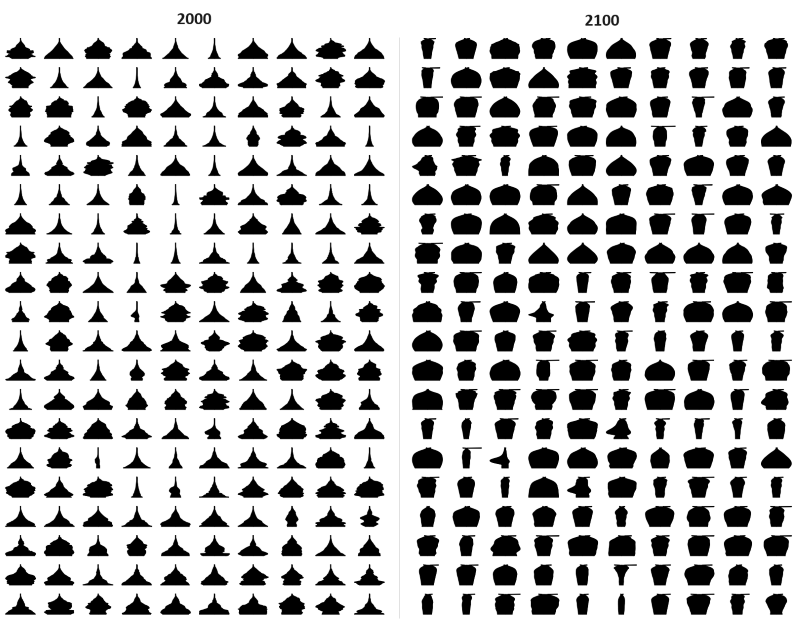
▲ → ▼ in a century. What happens? To the economy, culture, technology?
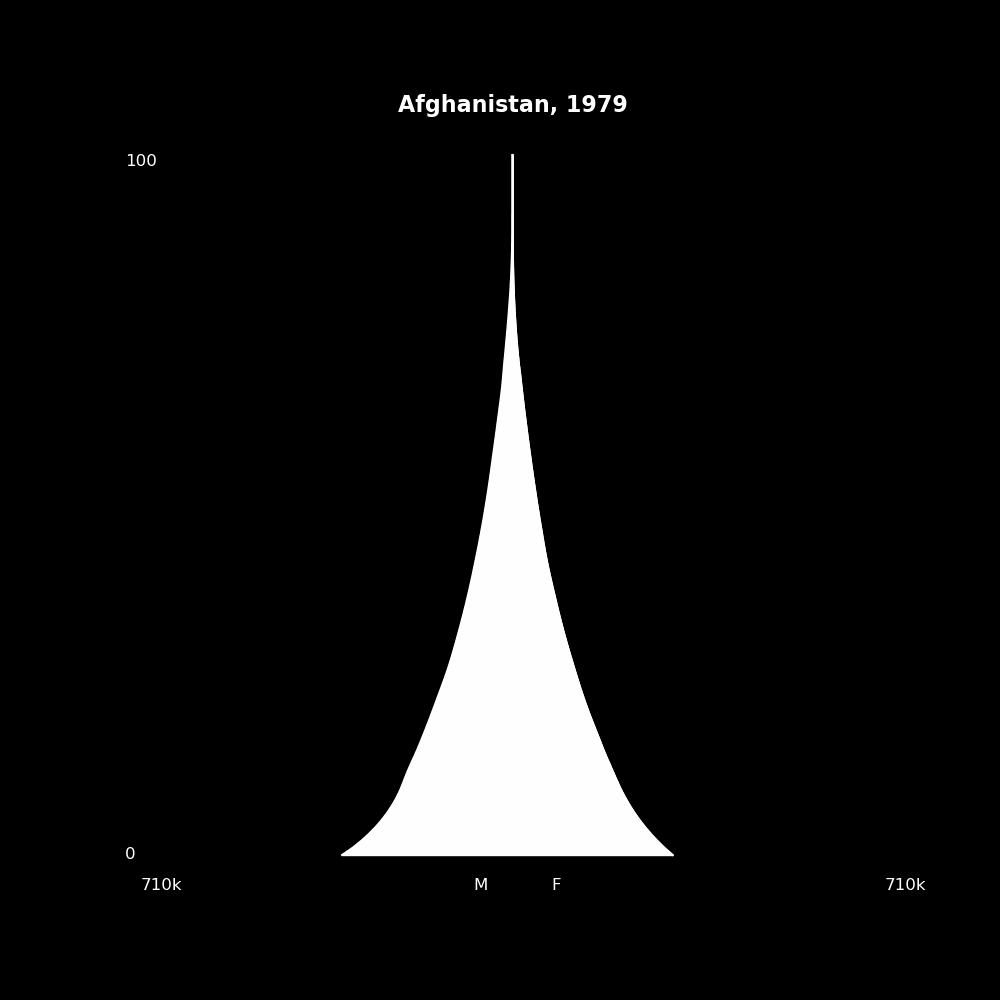
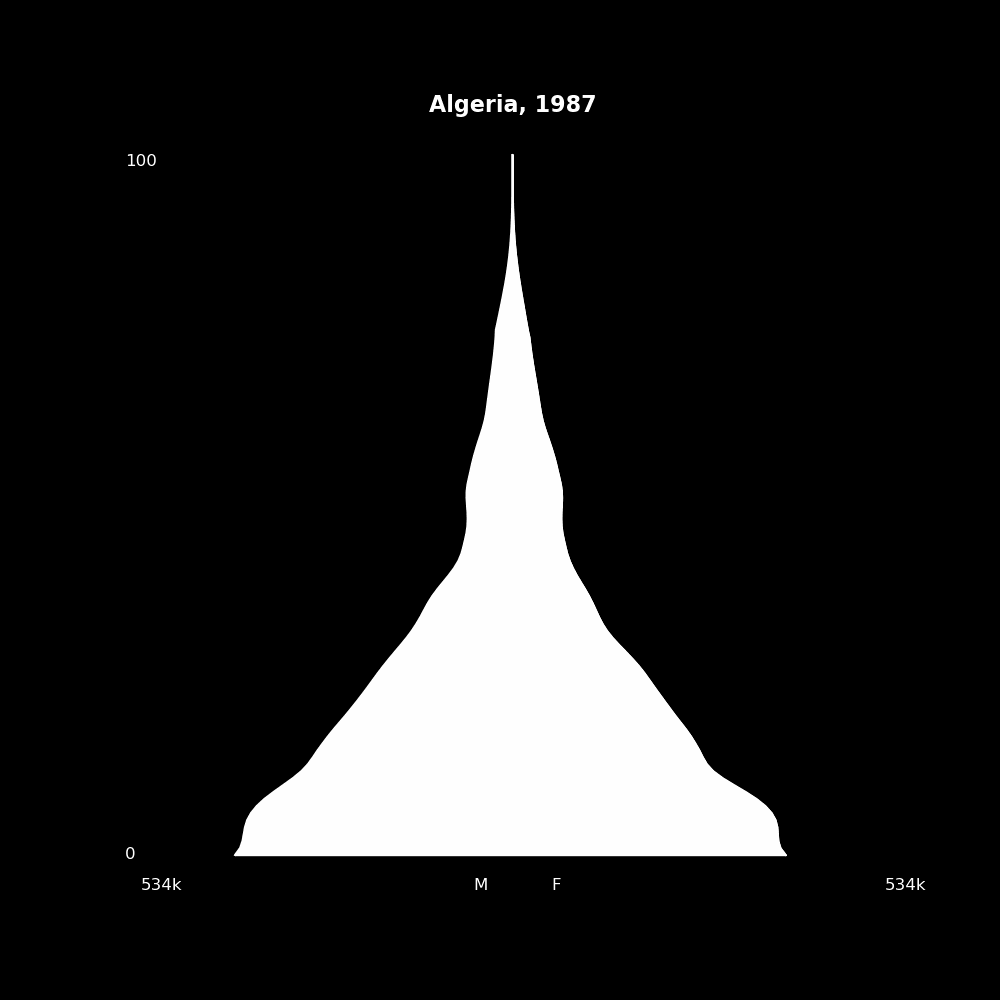
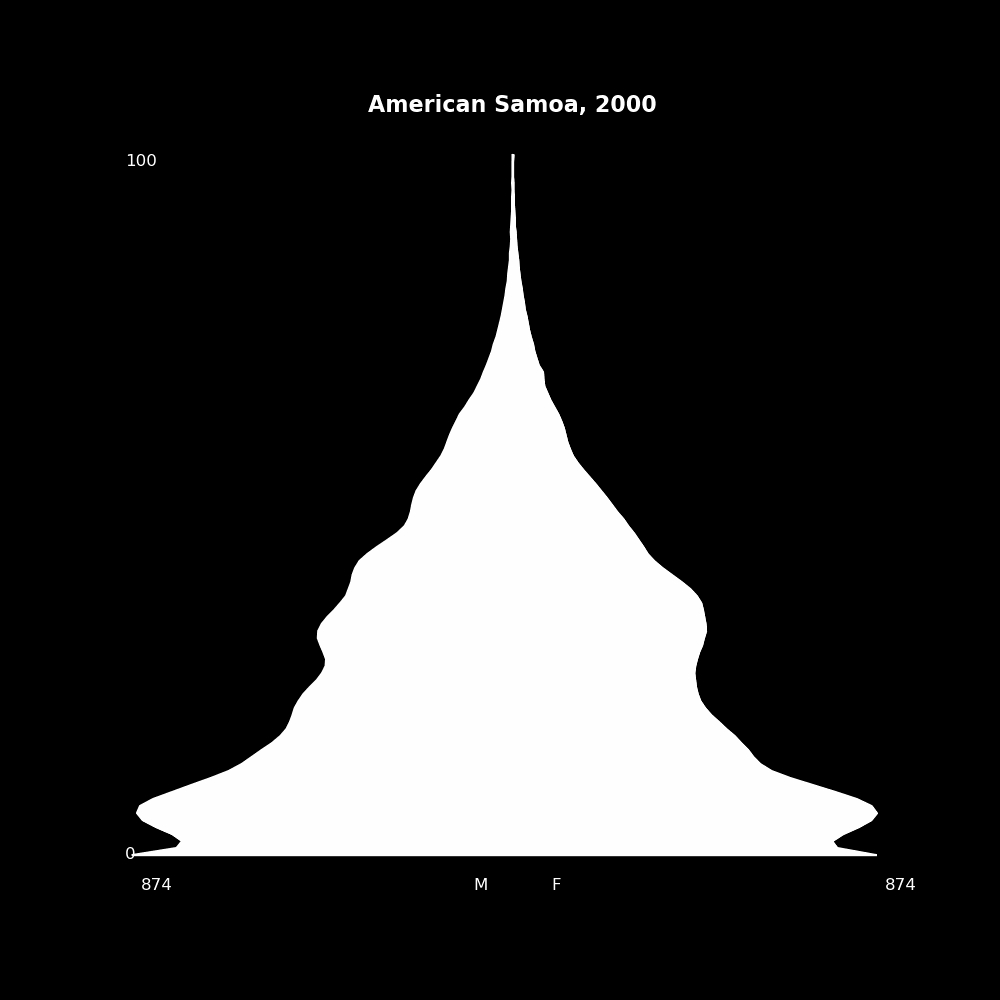
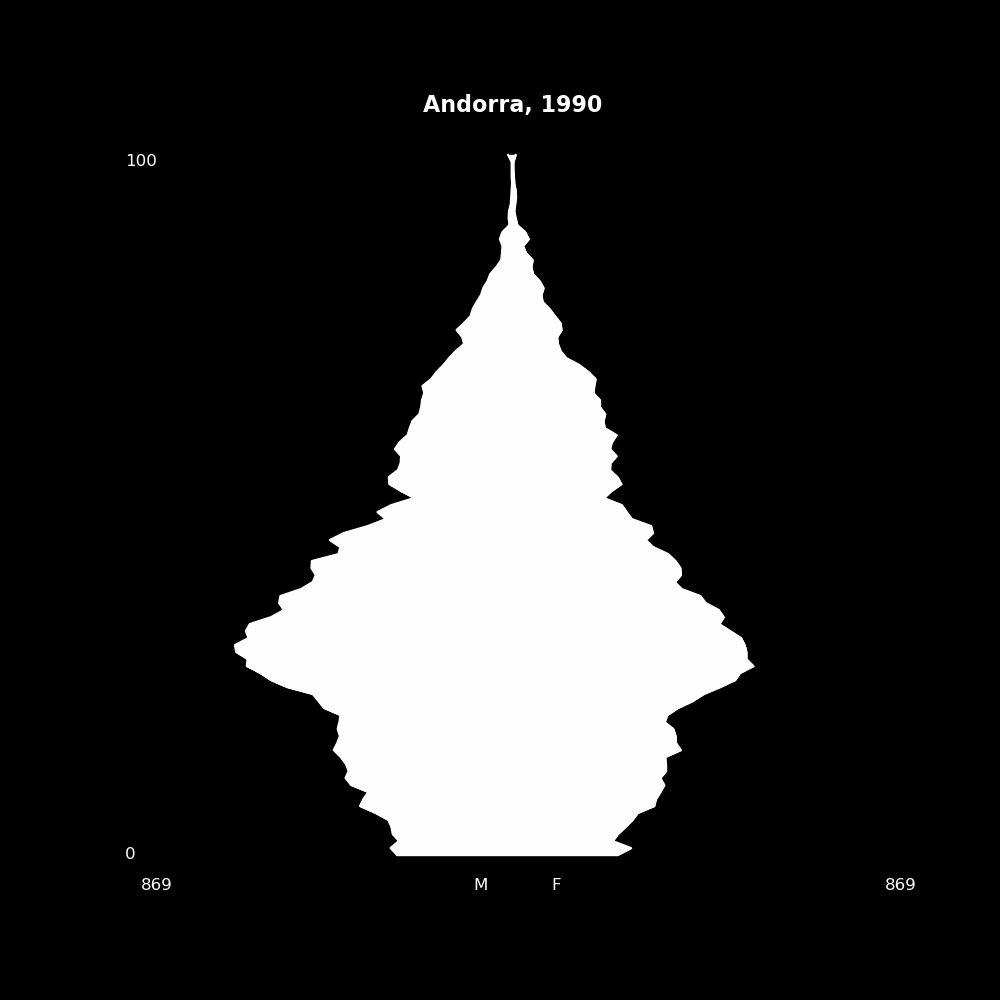
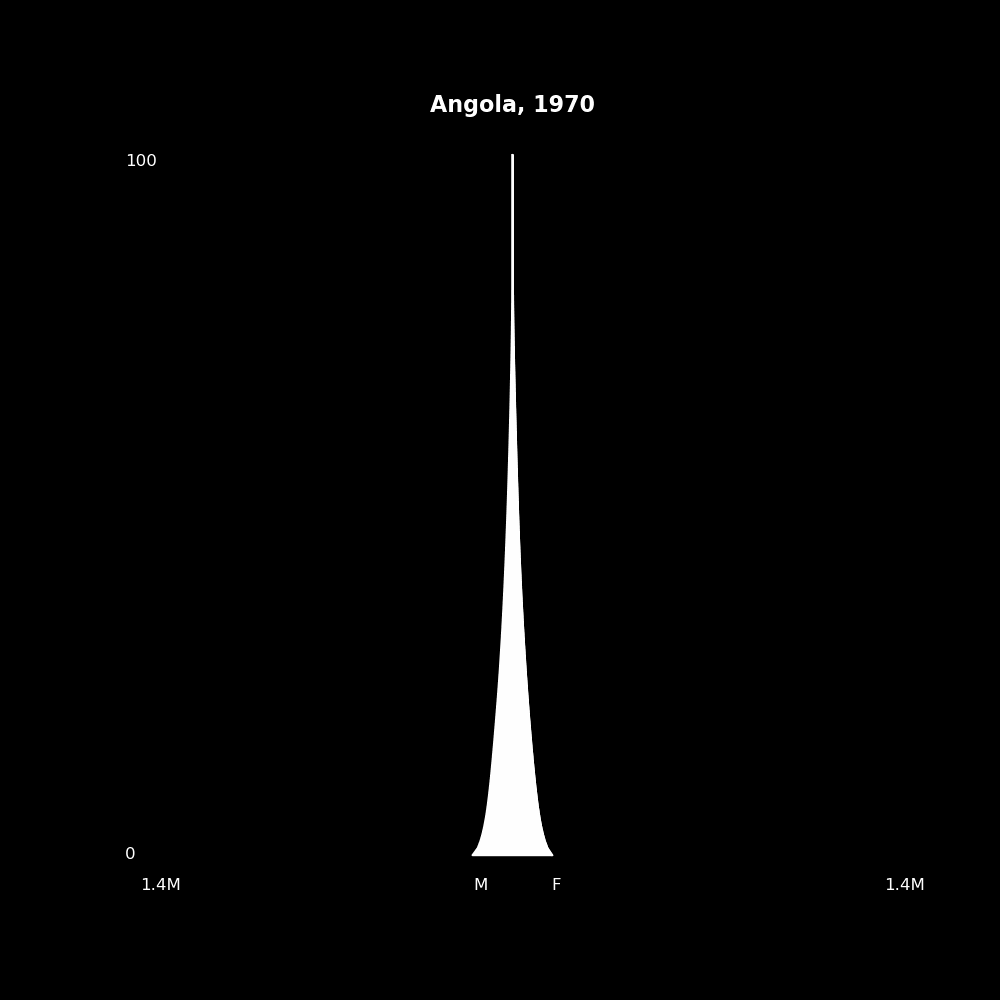
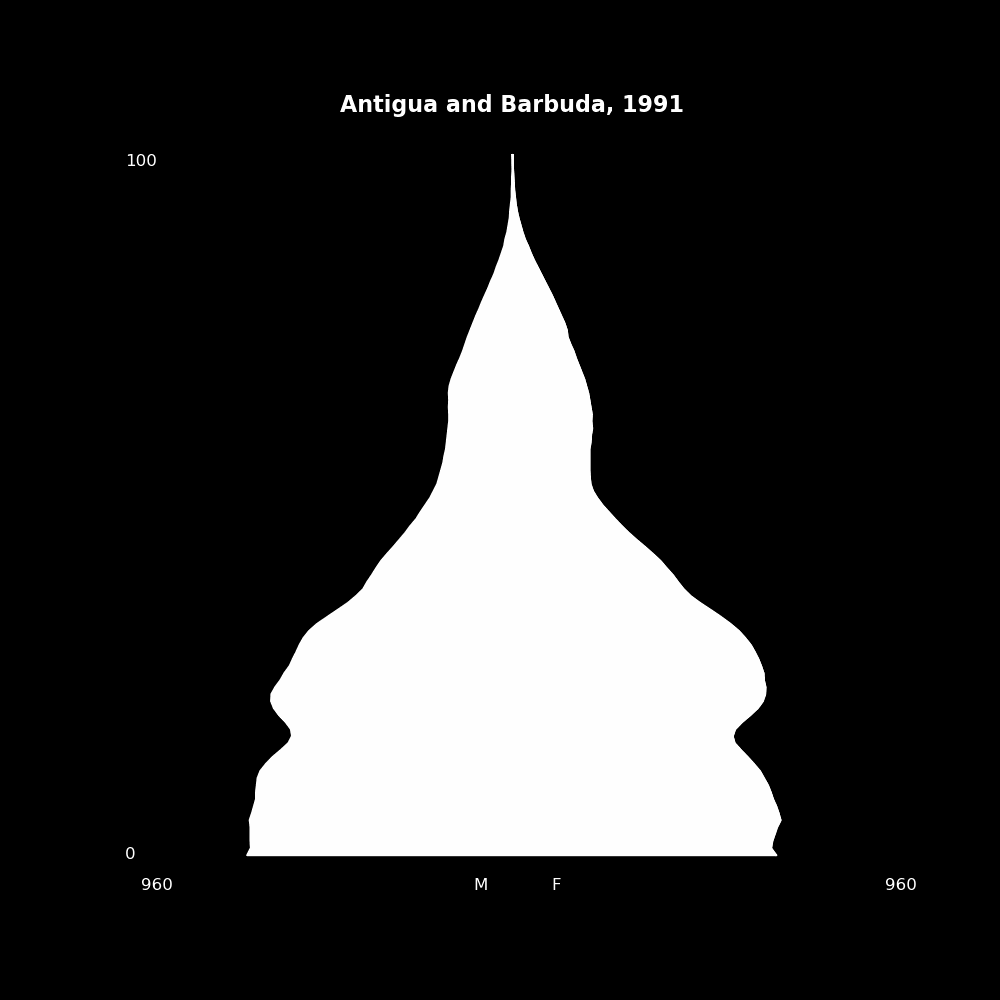
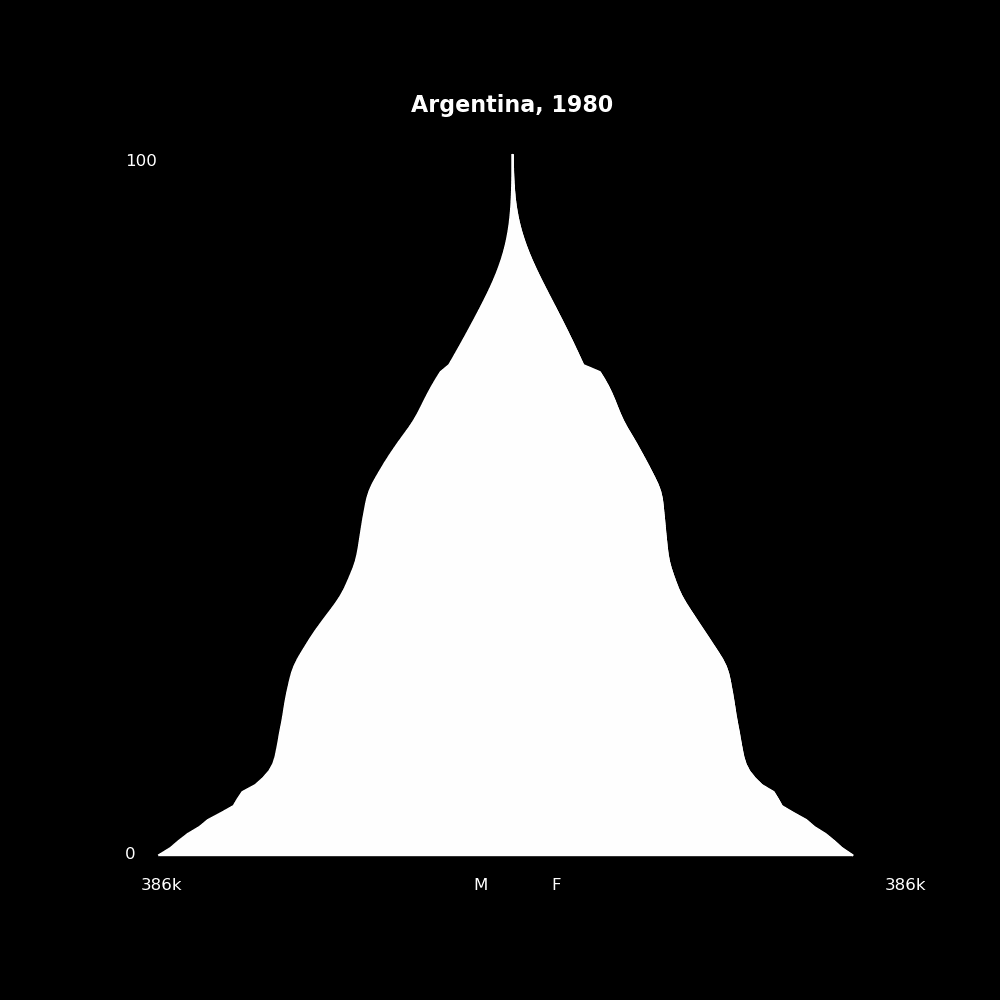
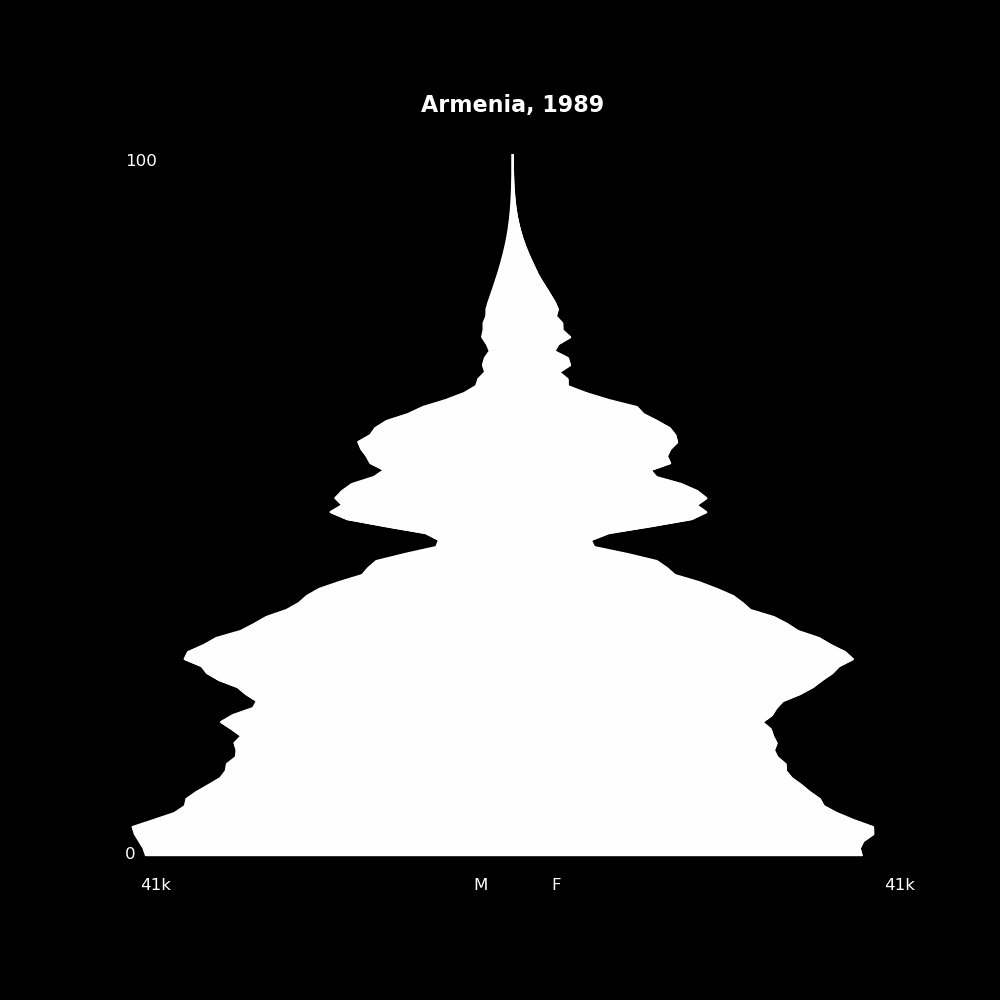
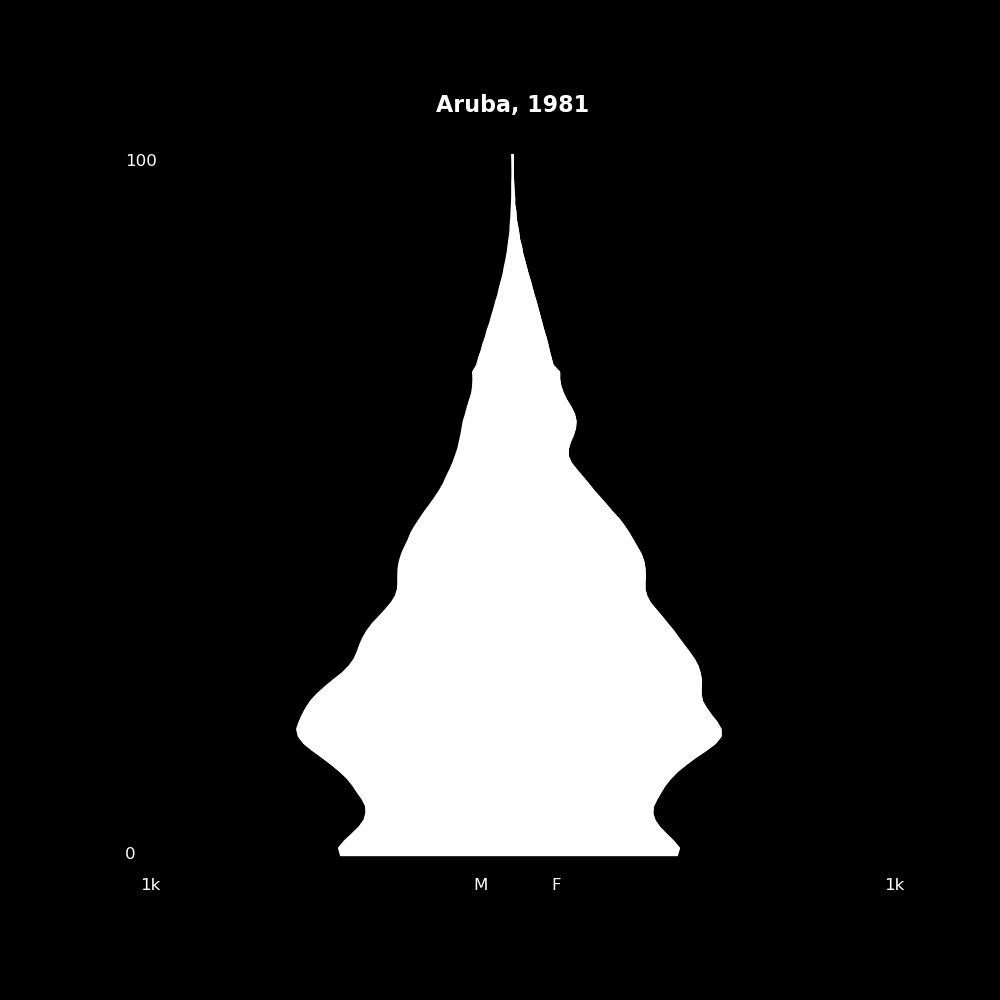
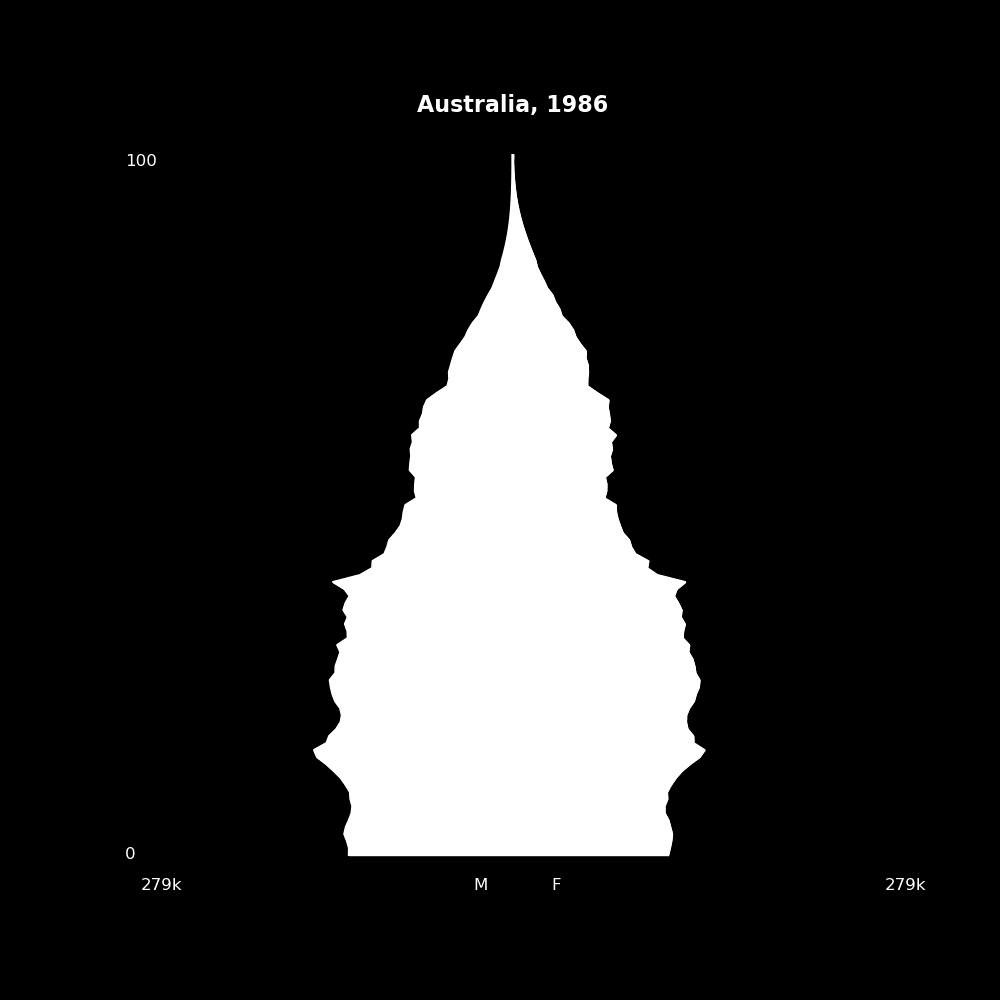
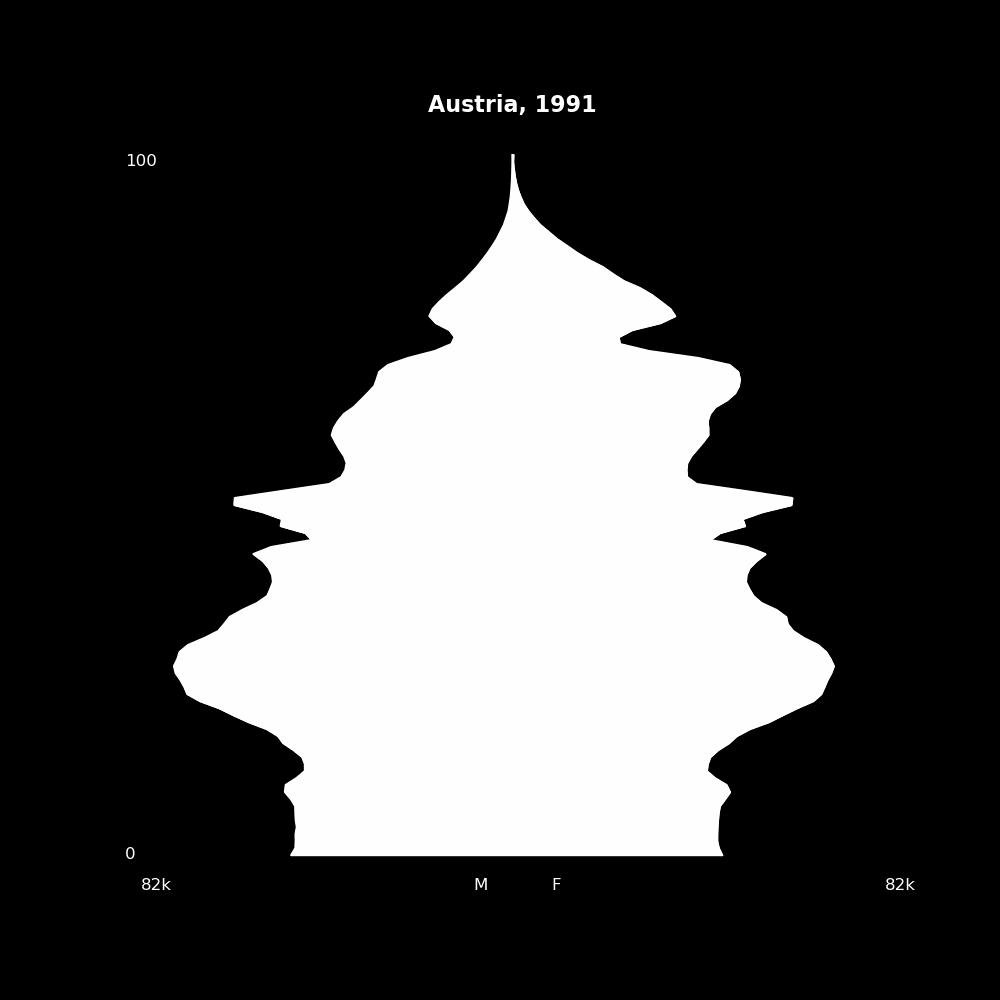
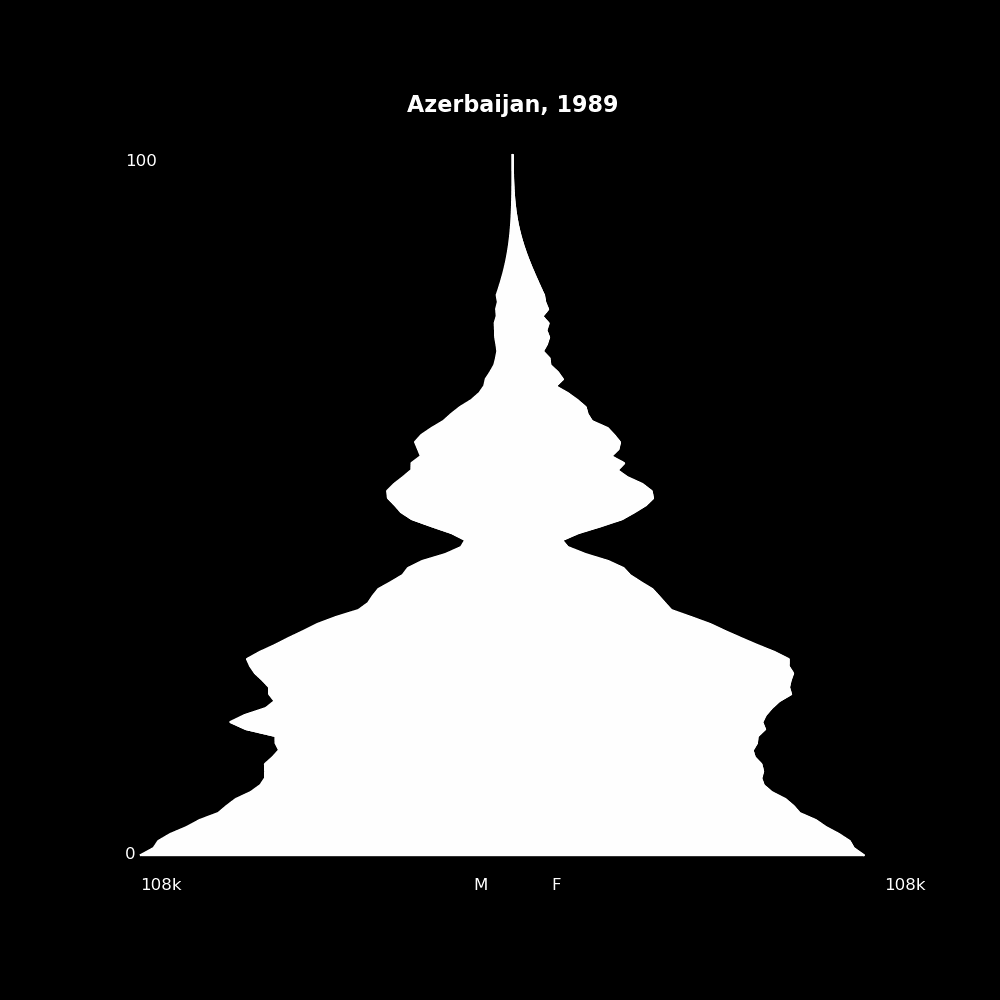
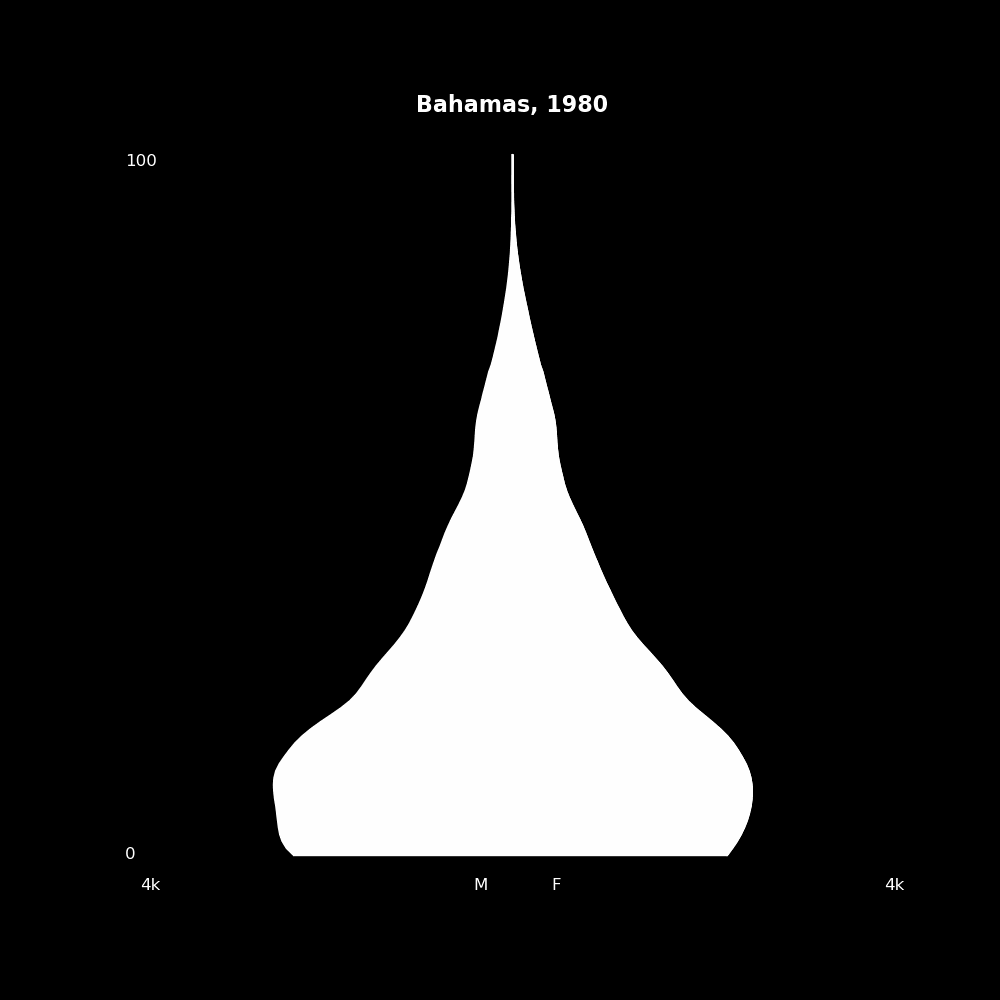
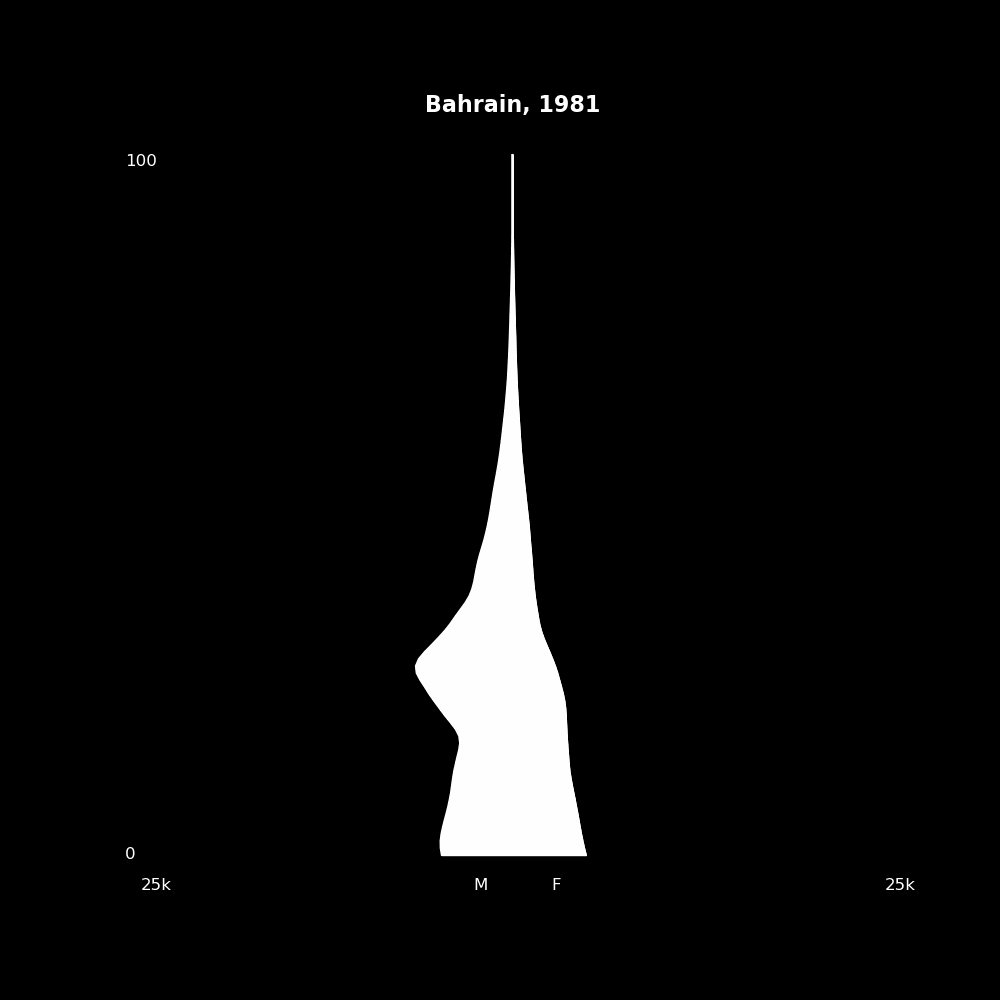
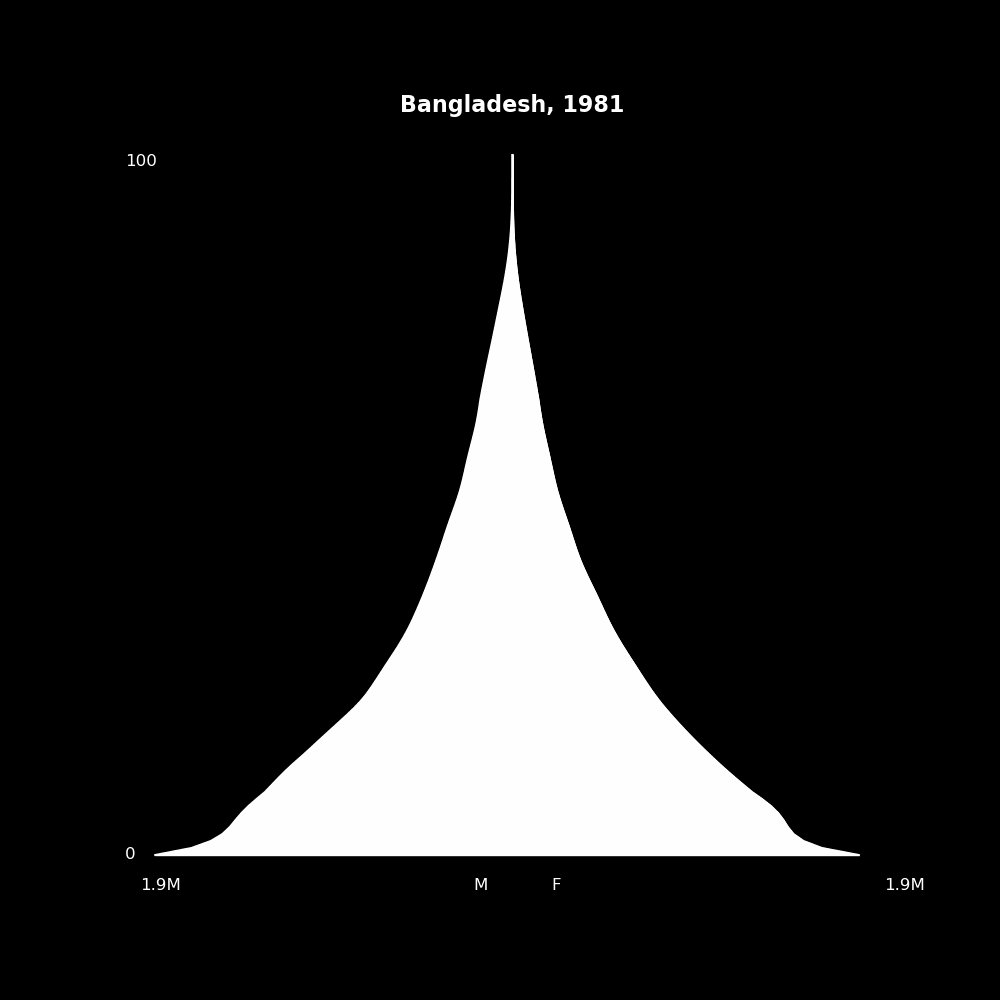
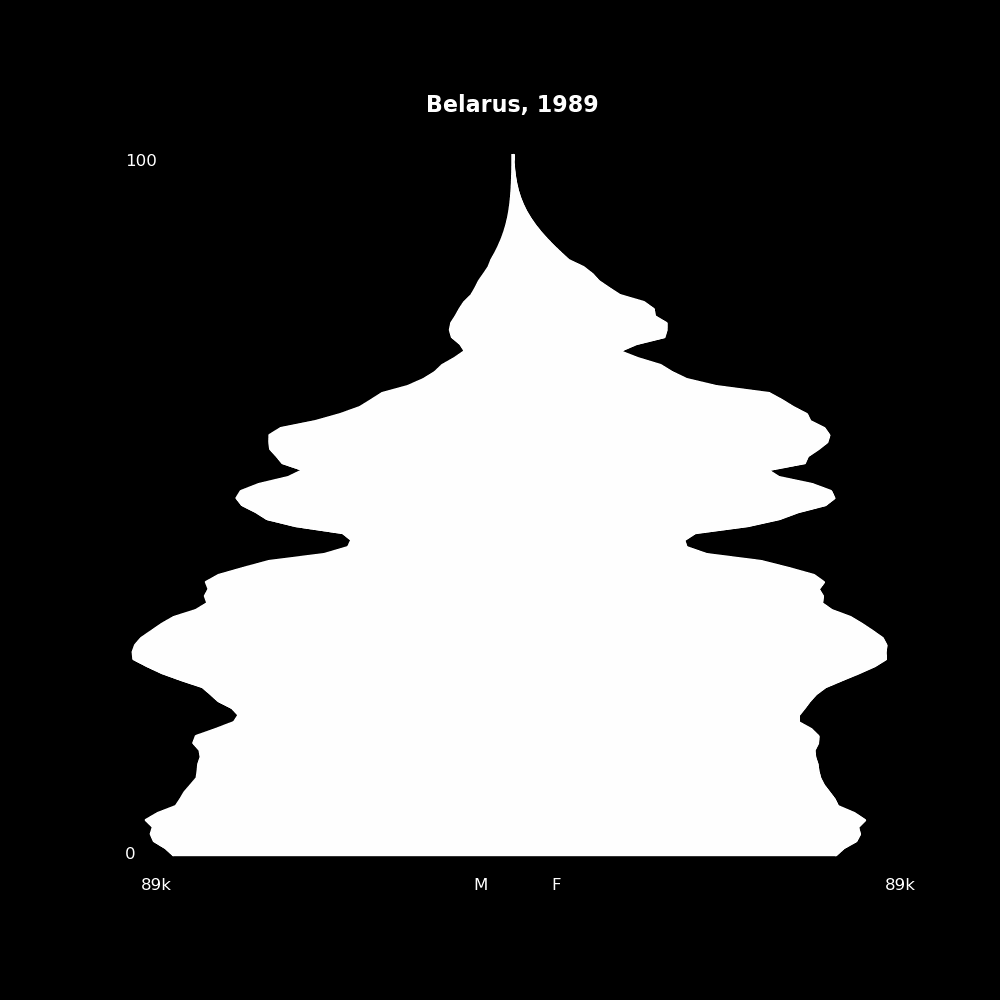
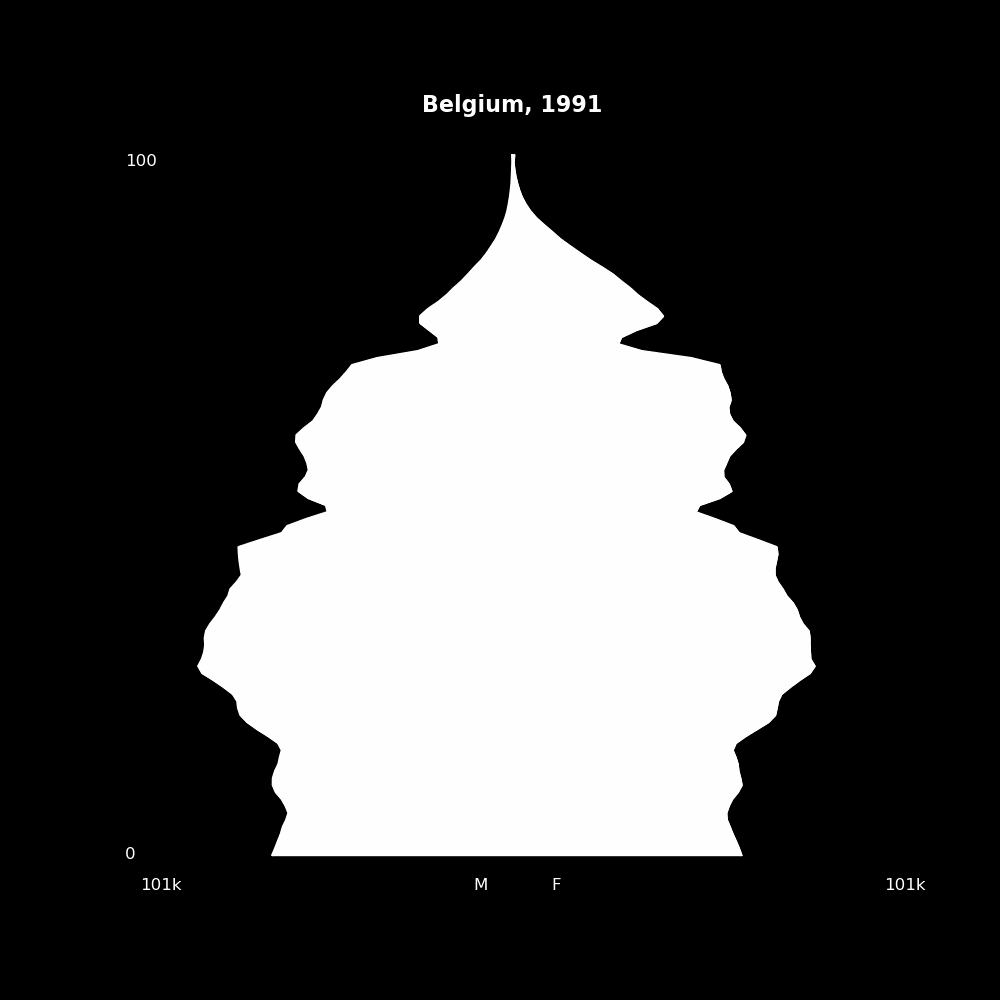
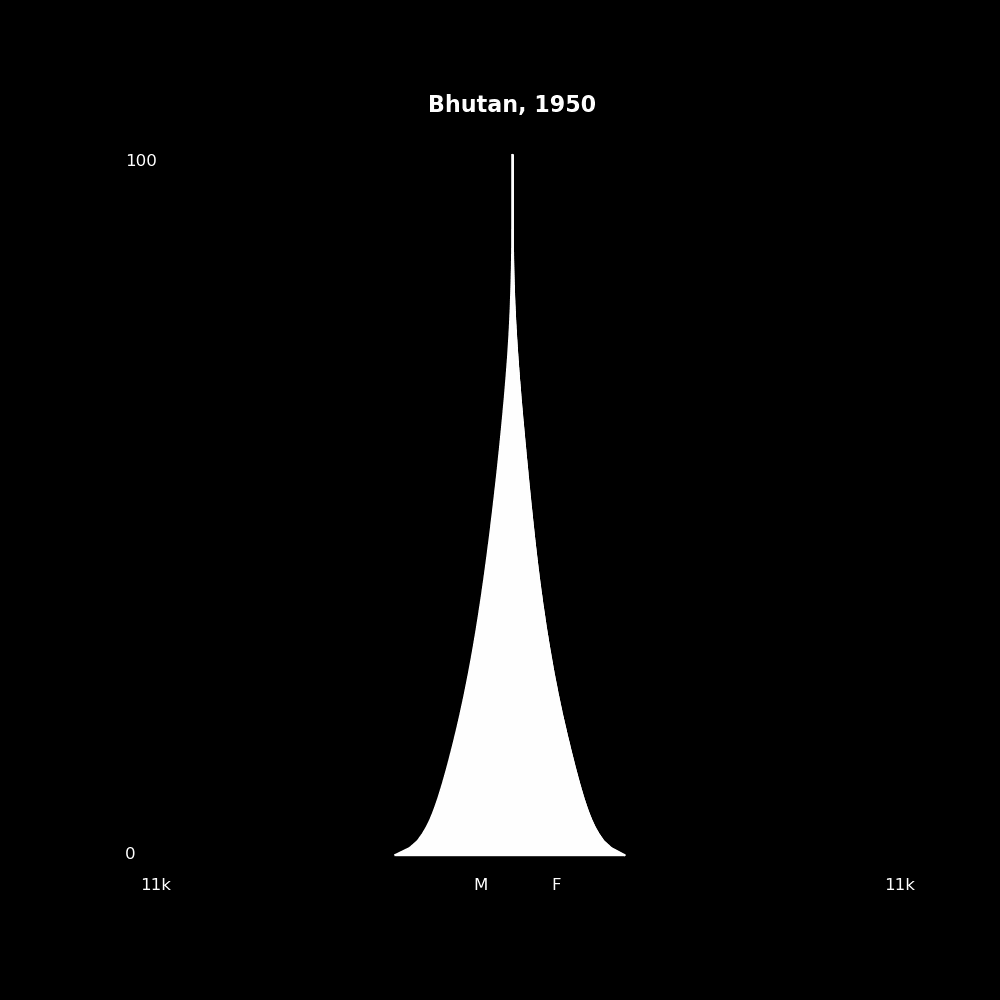
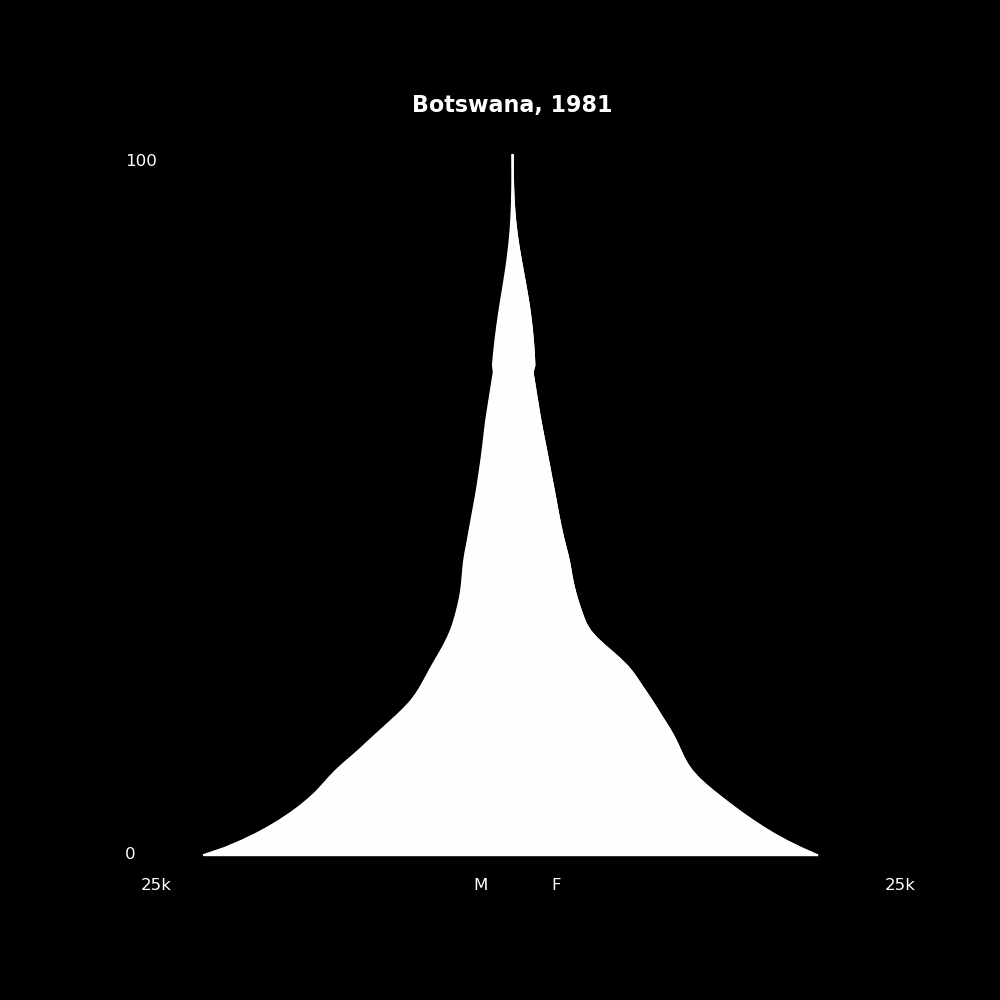
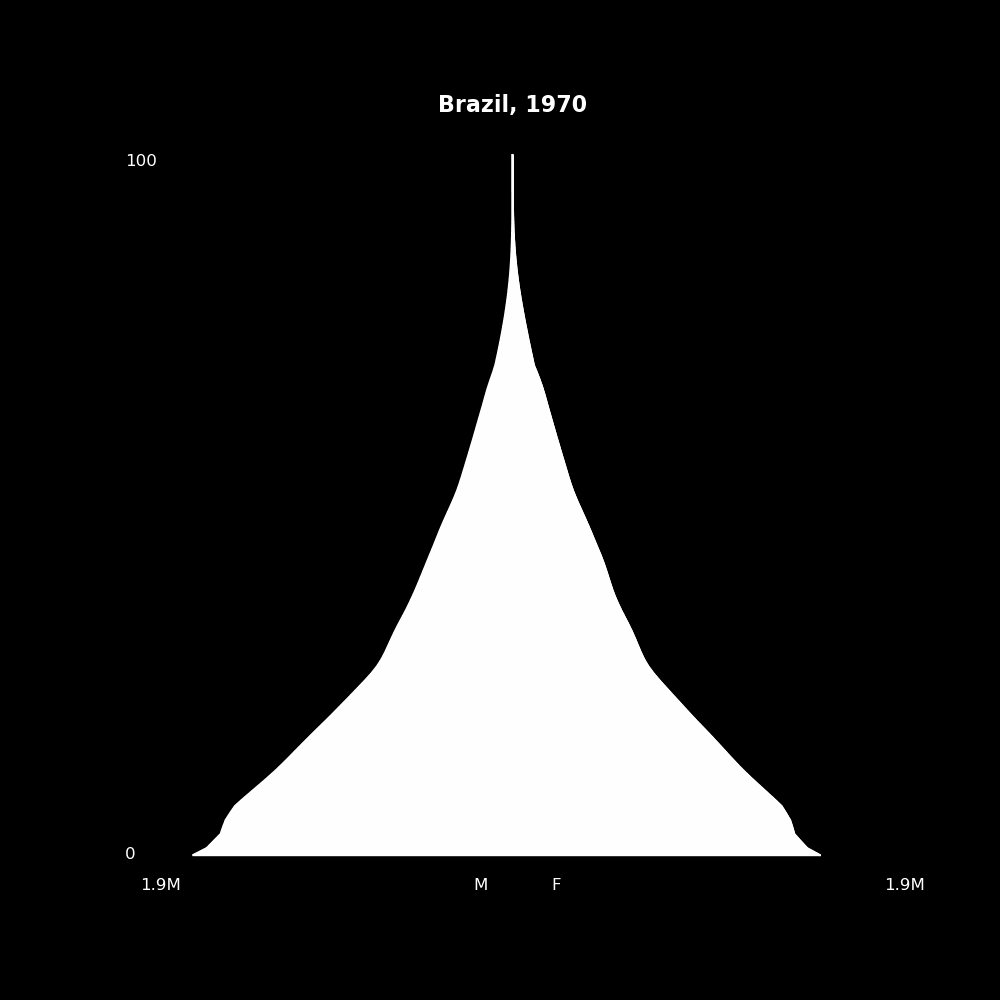
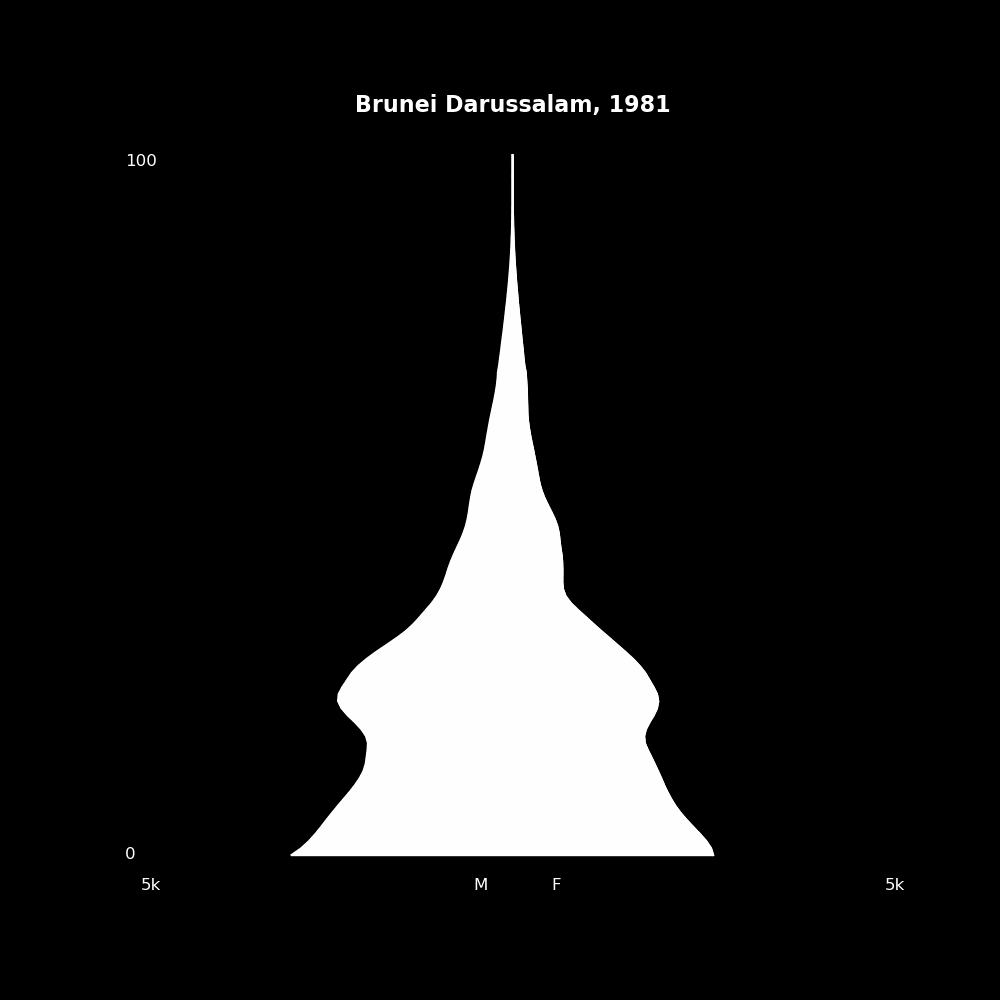
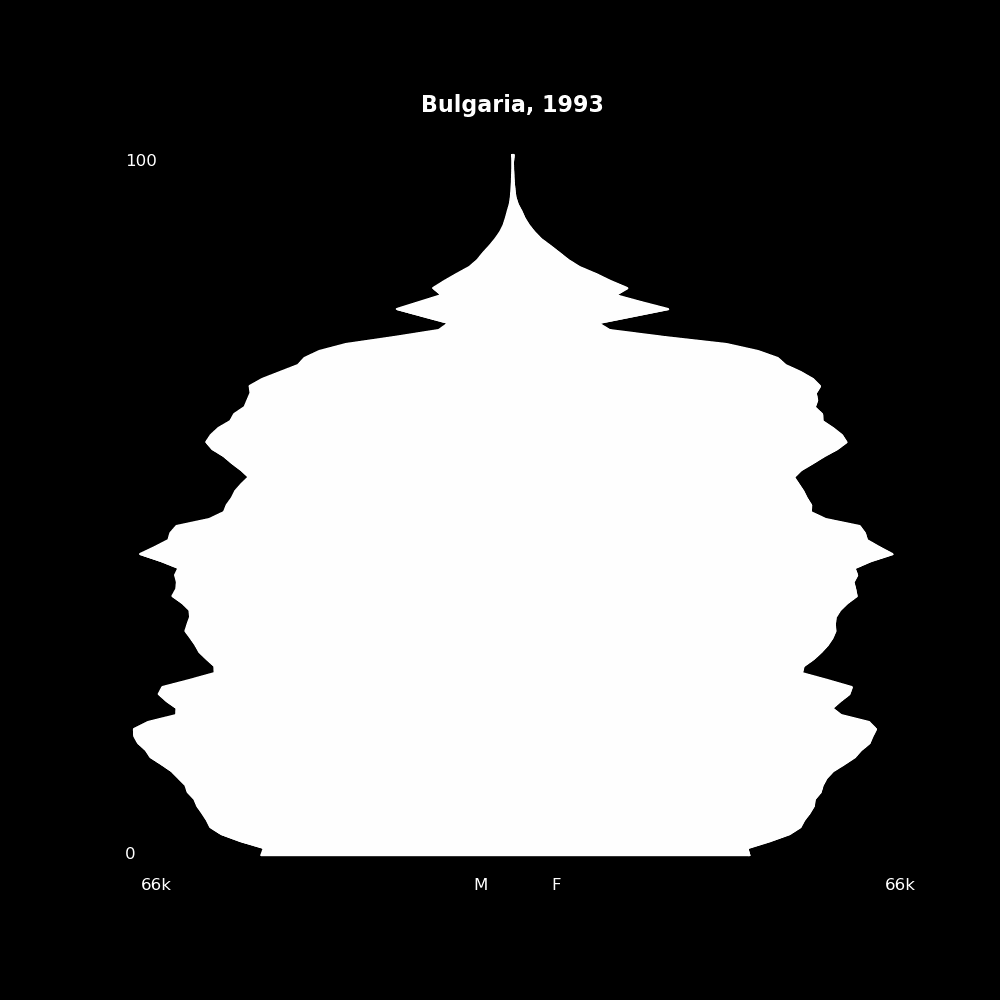
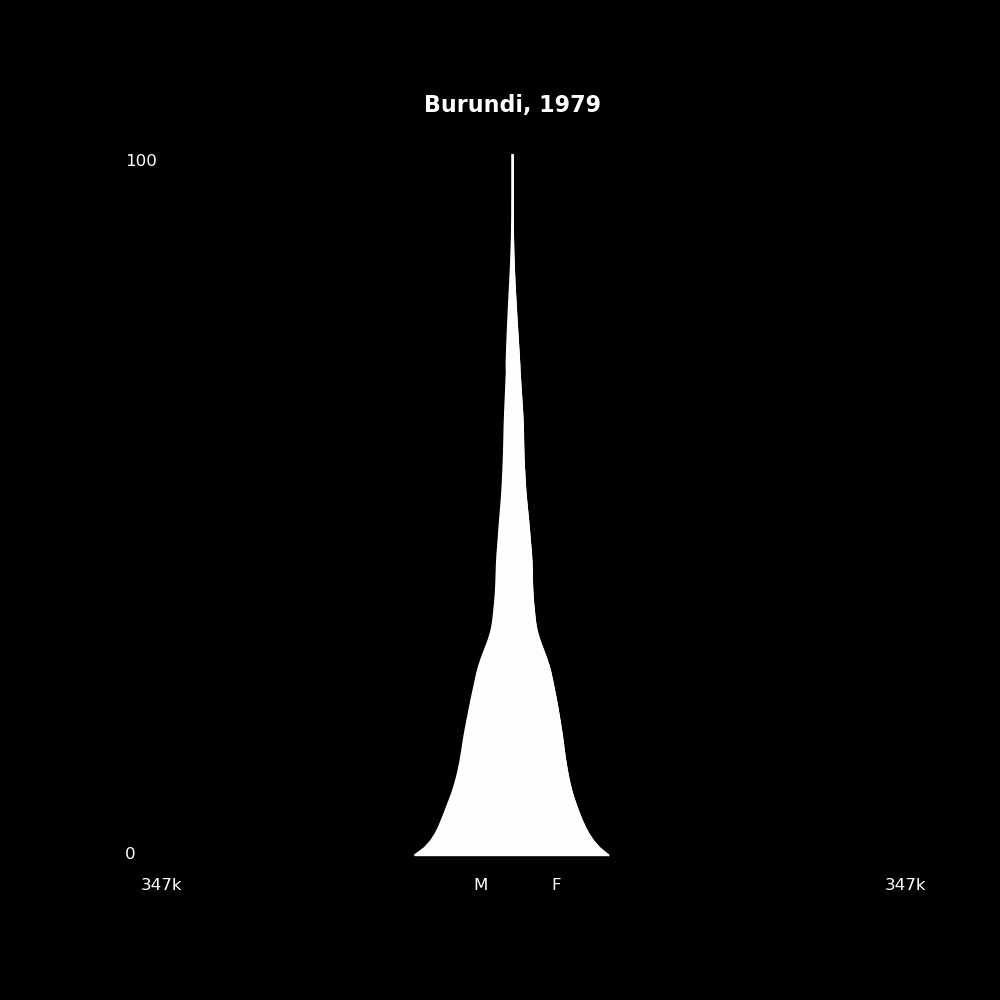
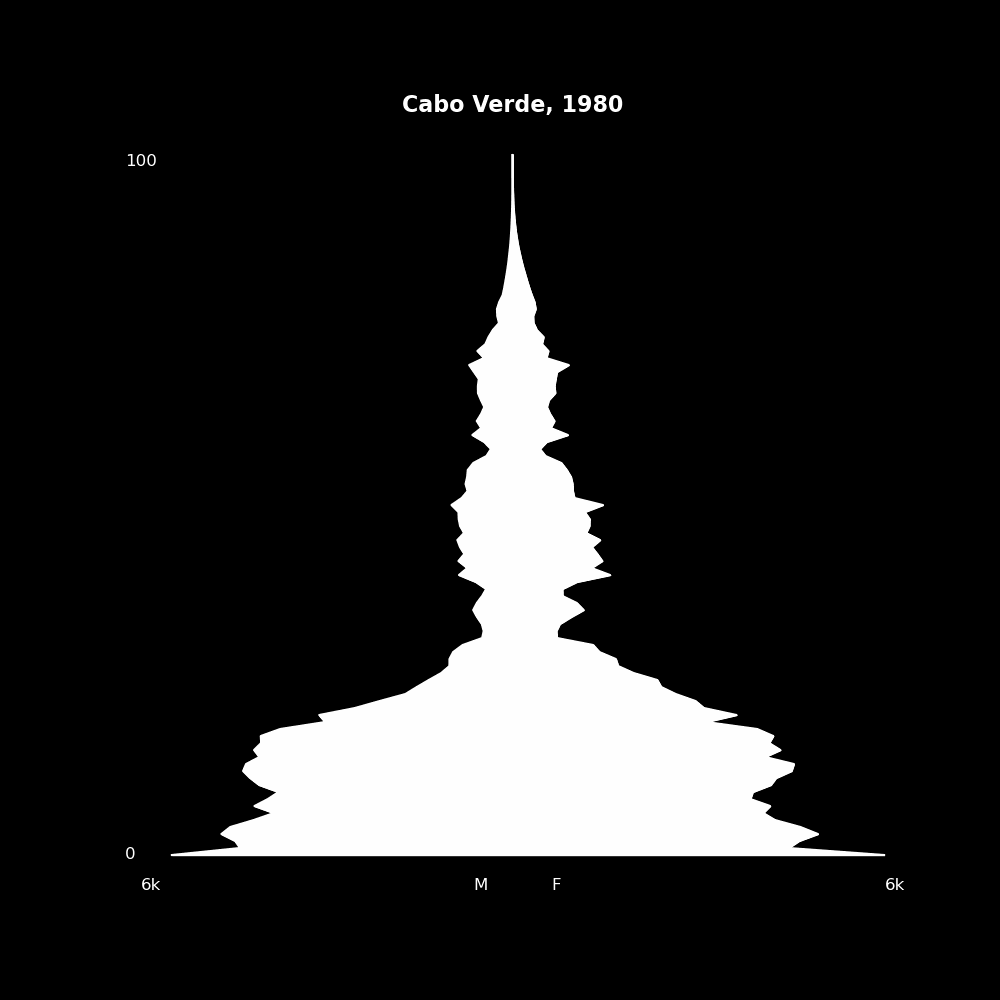
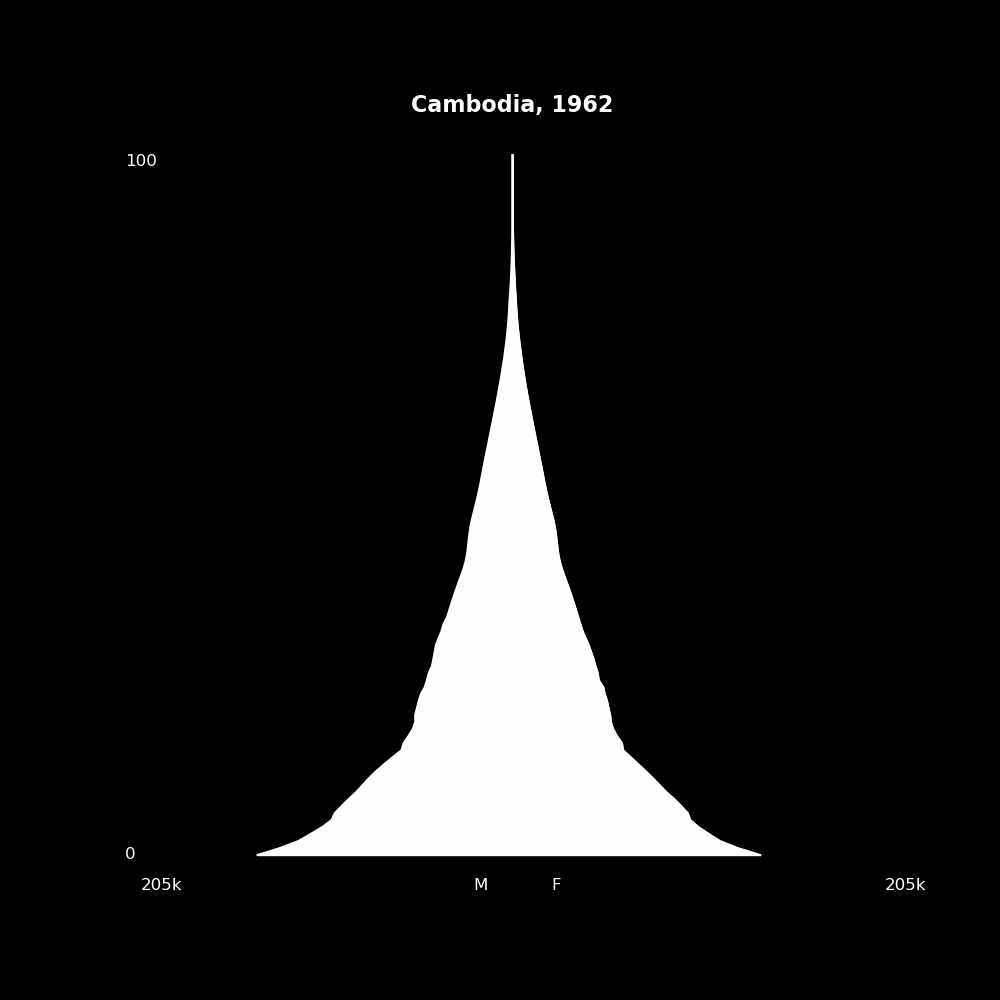
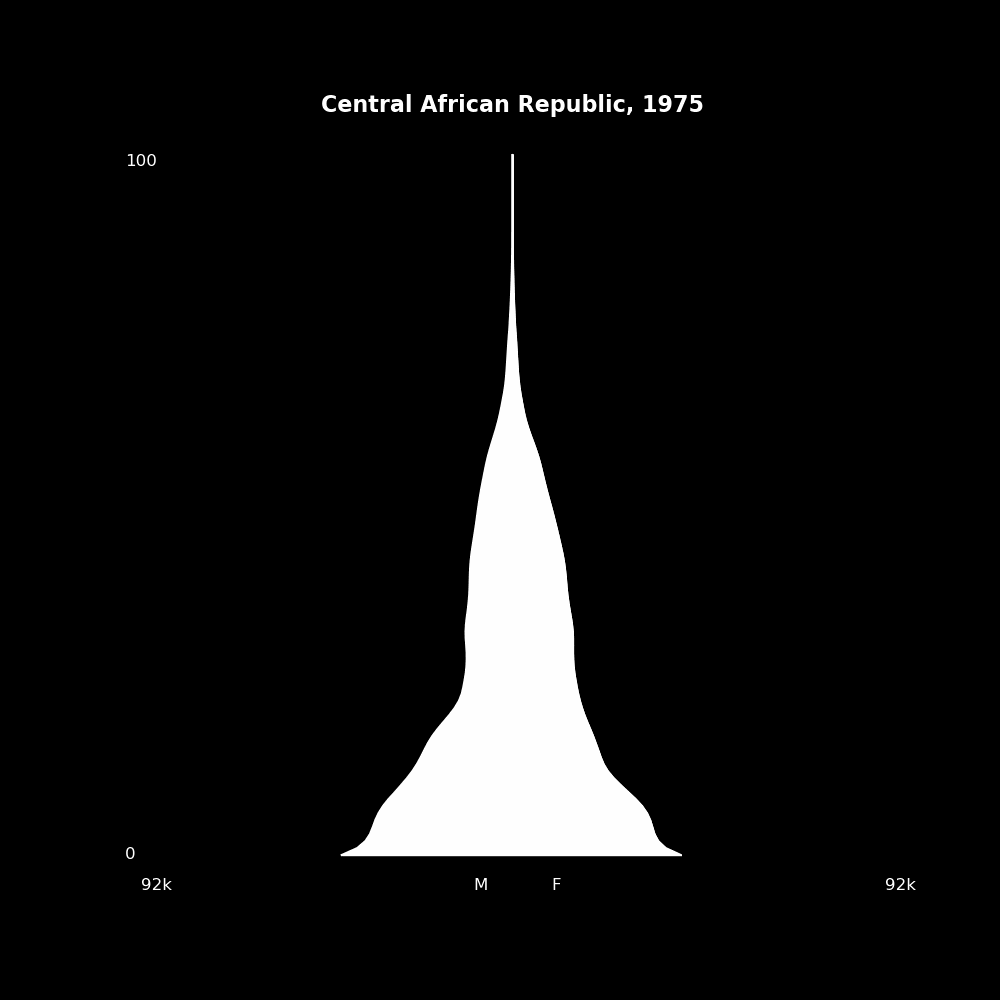
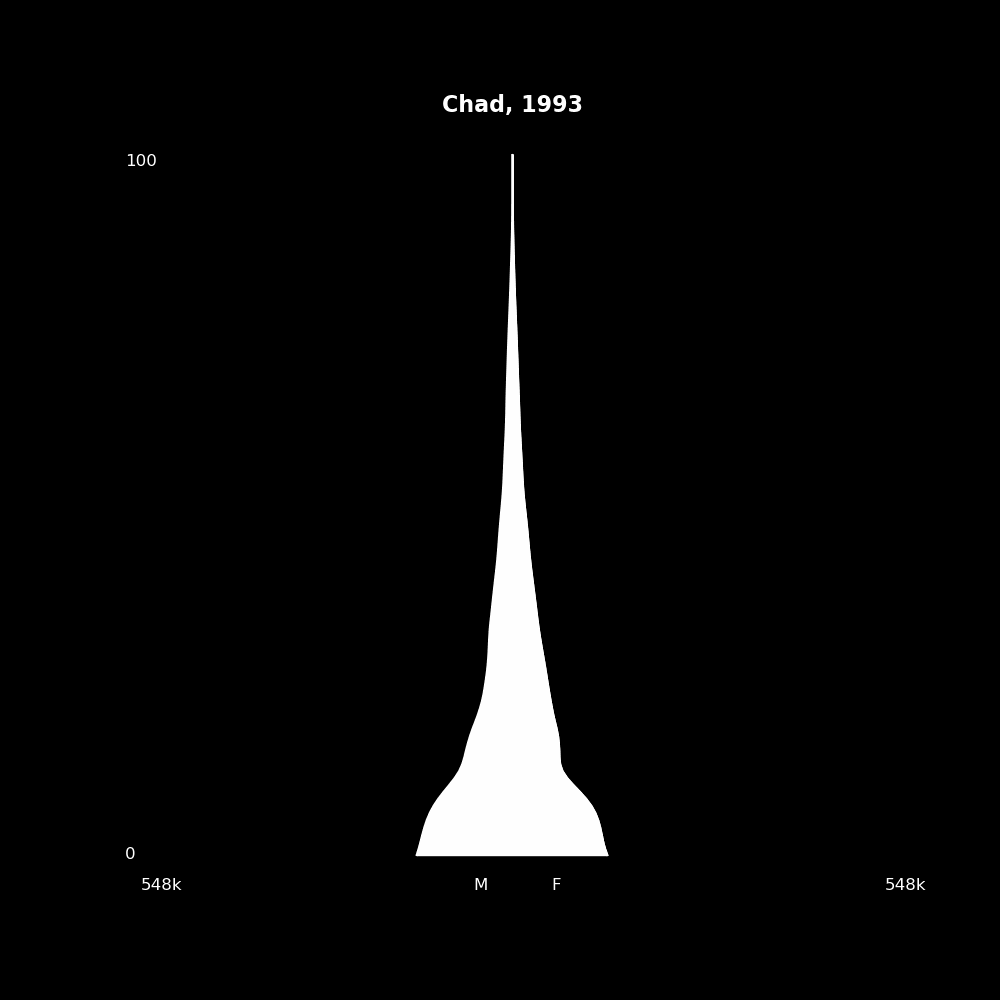
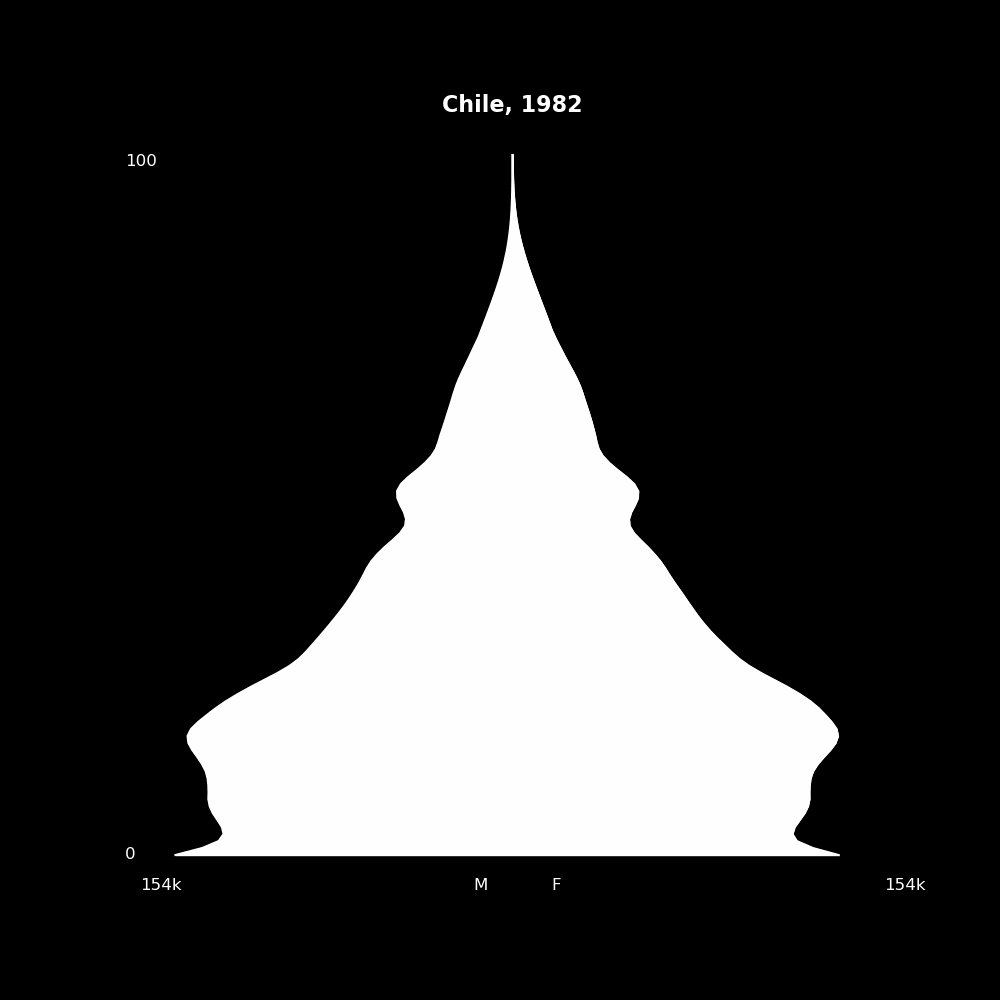
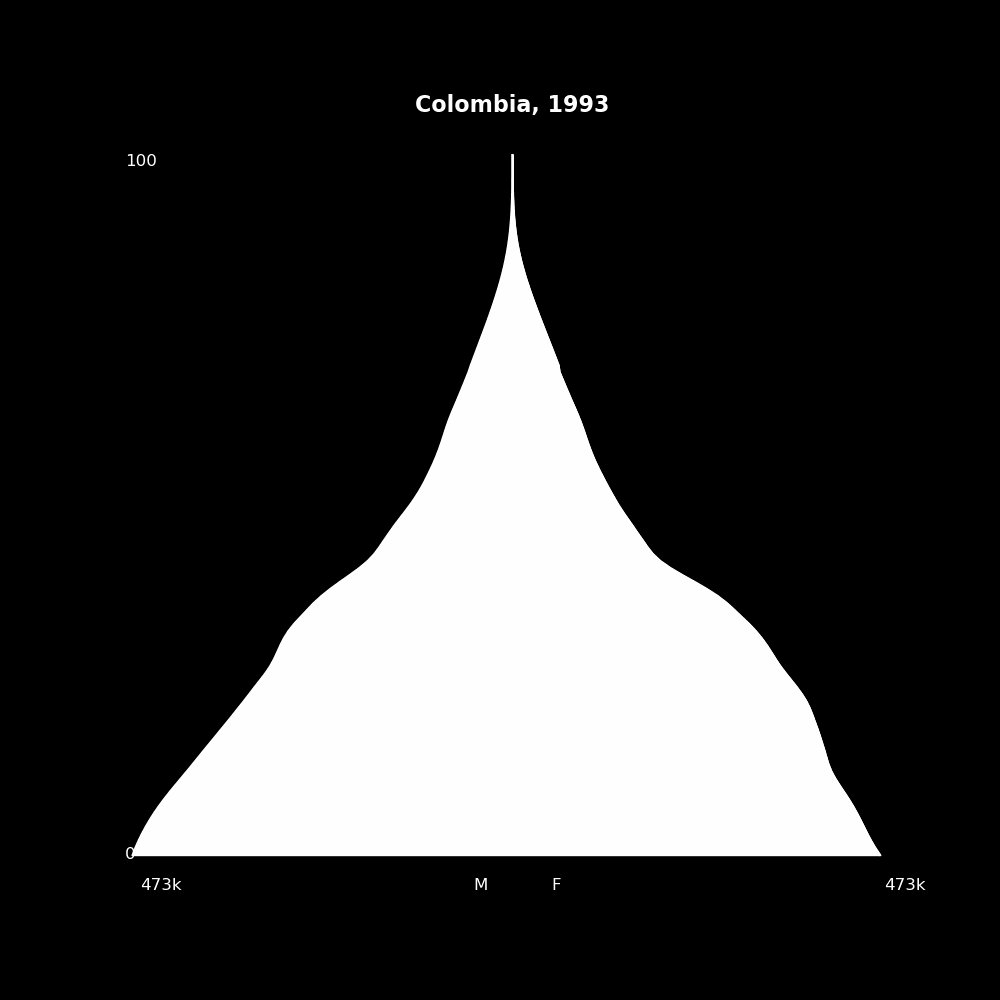
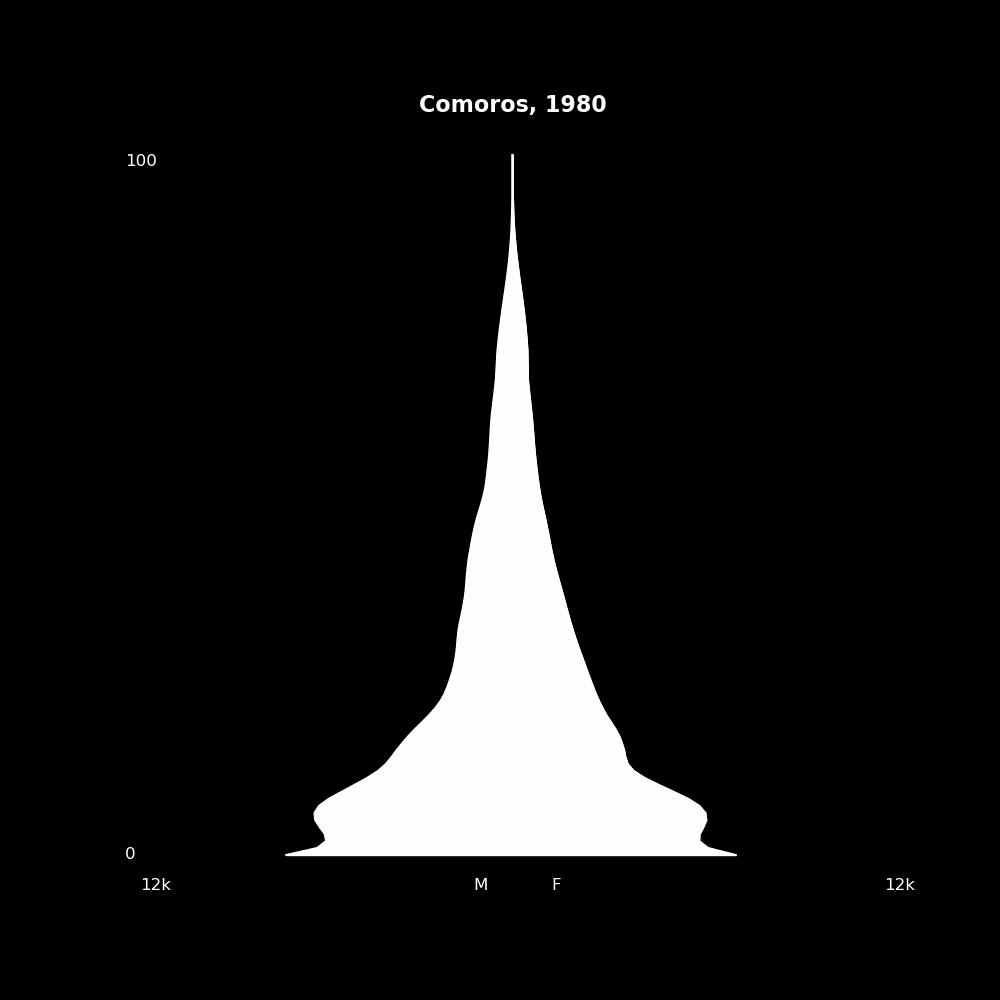
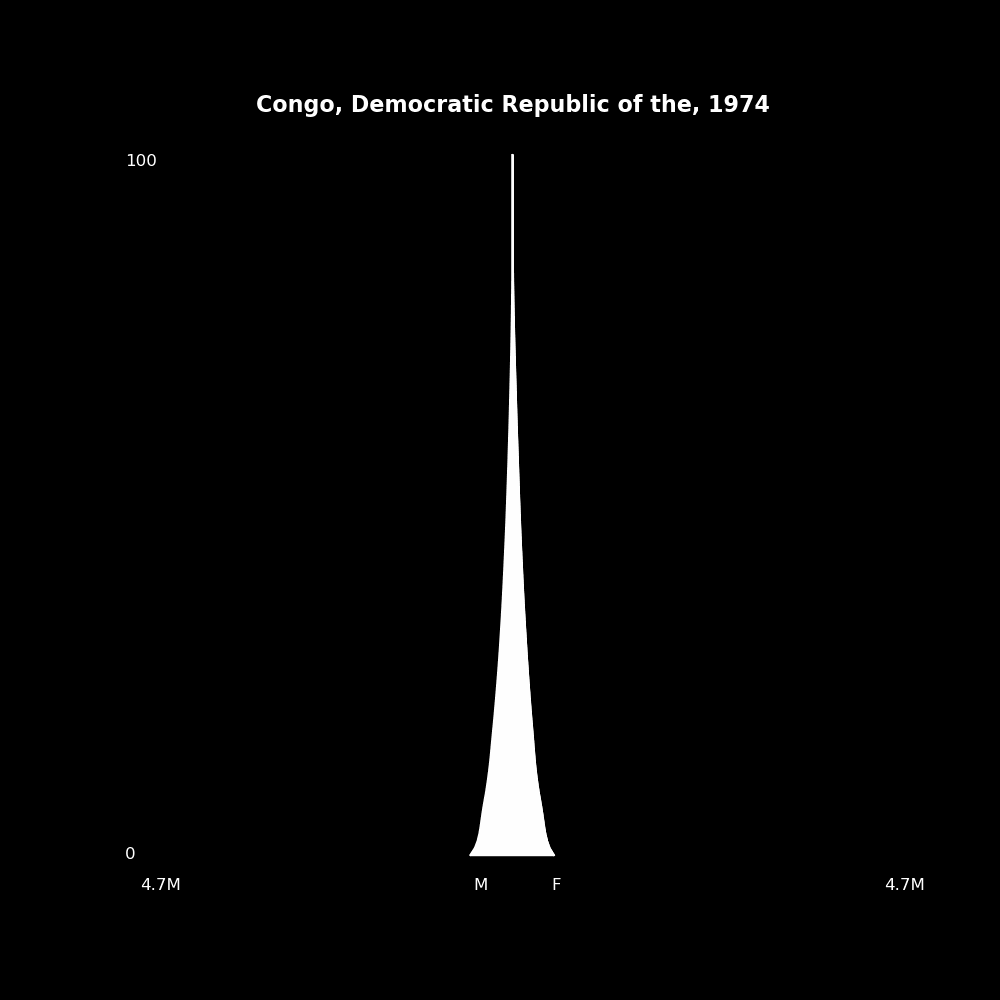
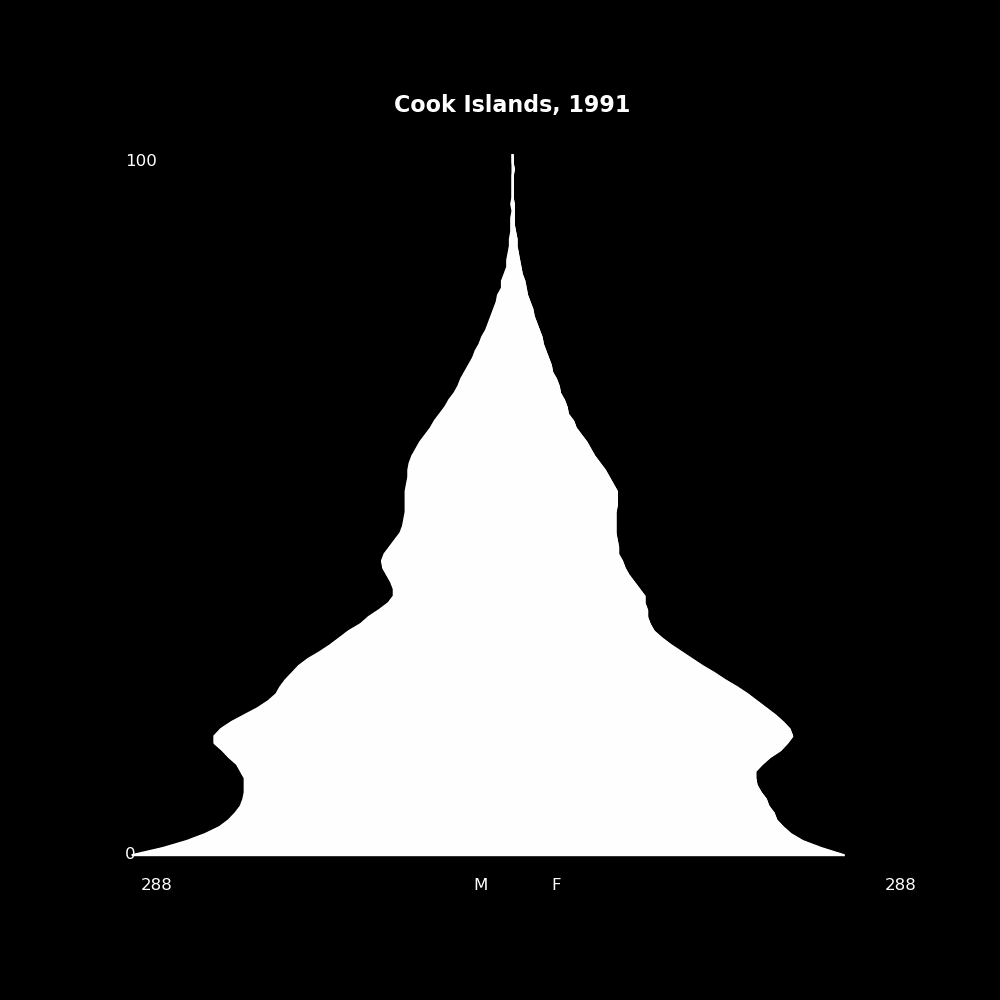
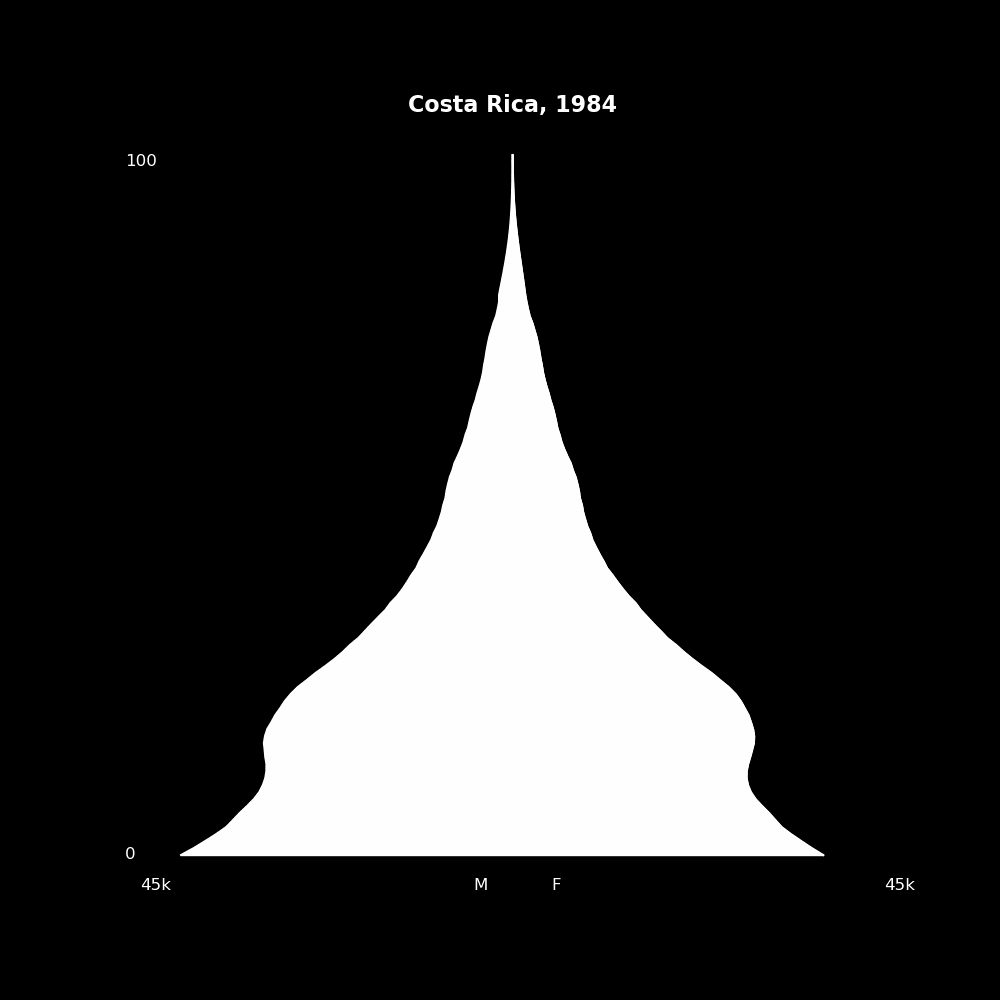
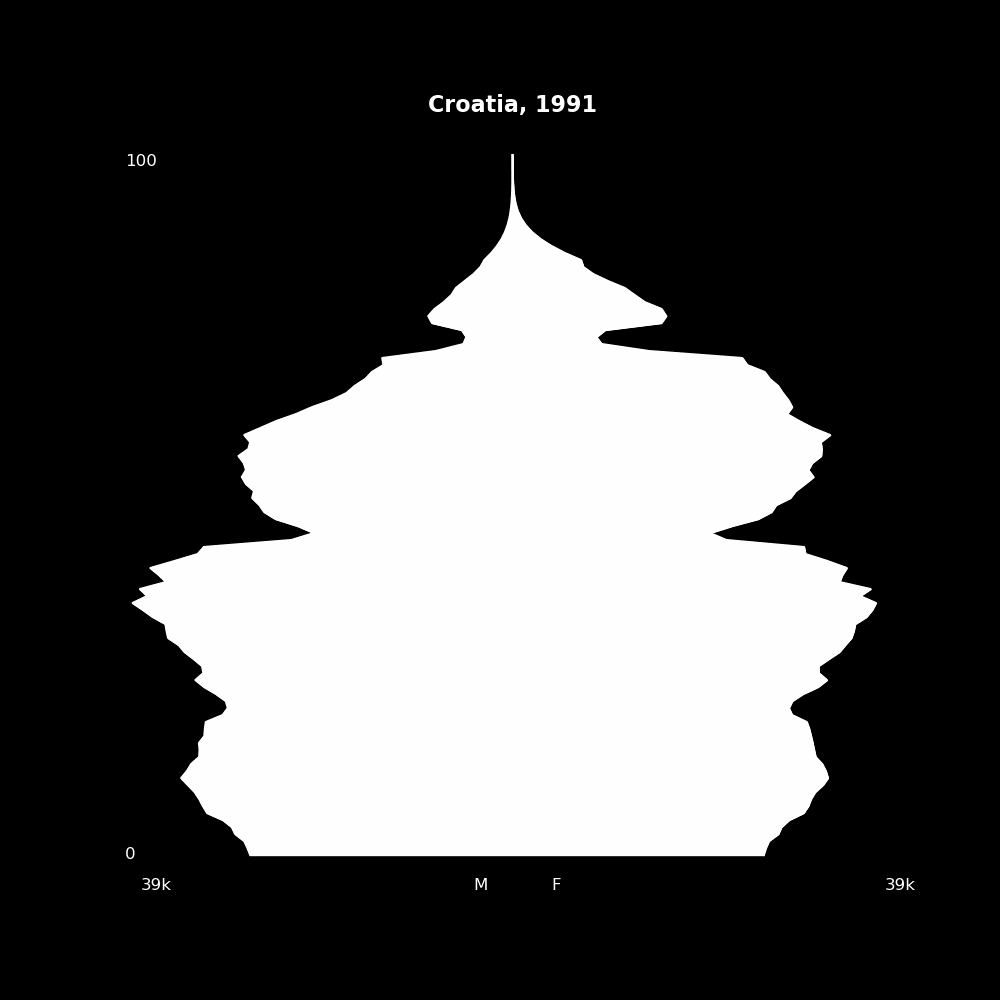
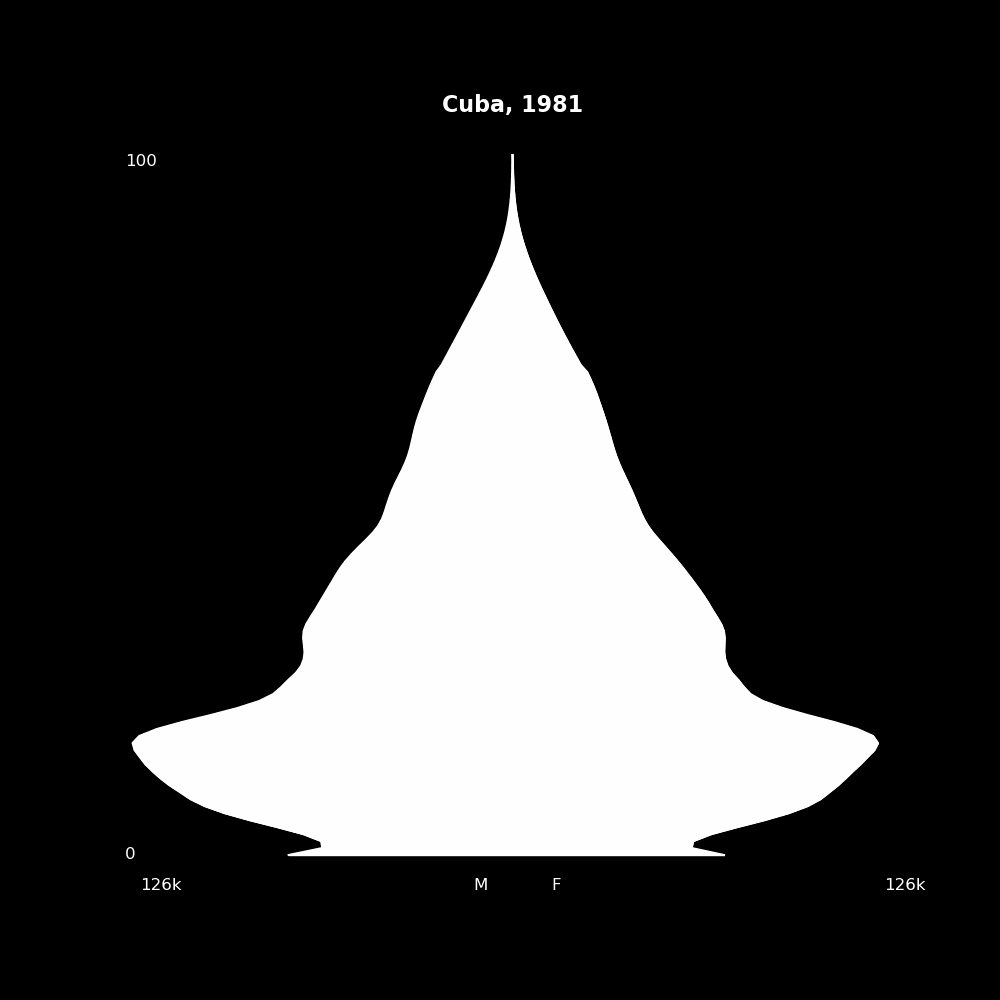
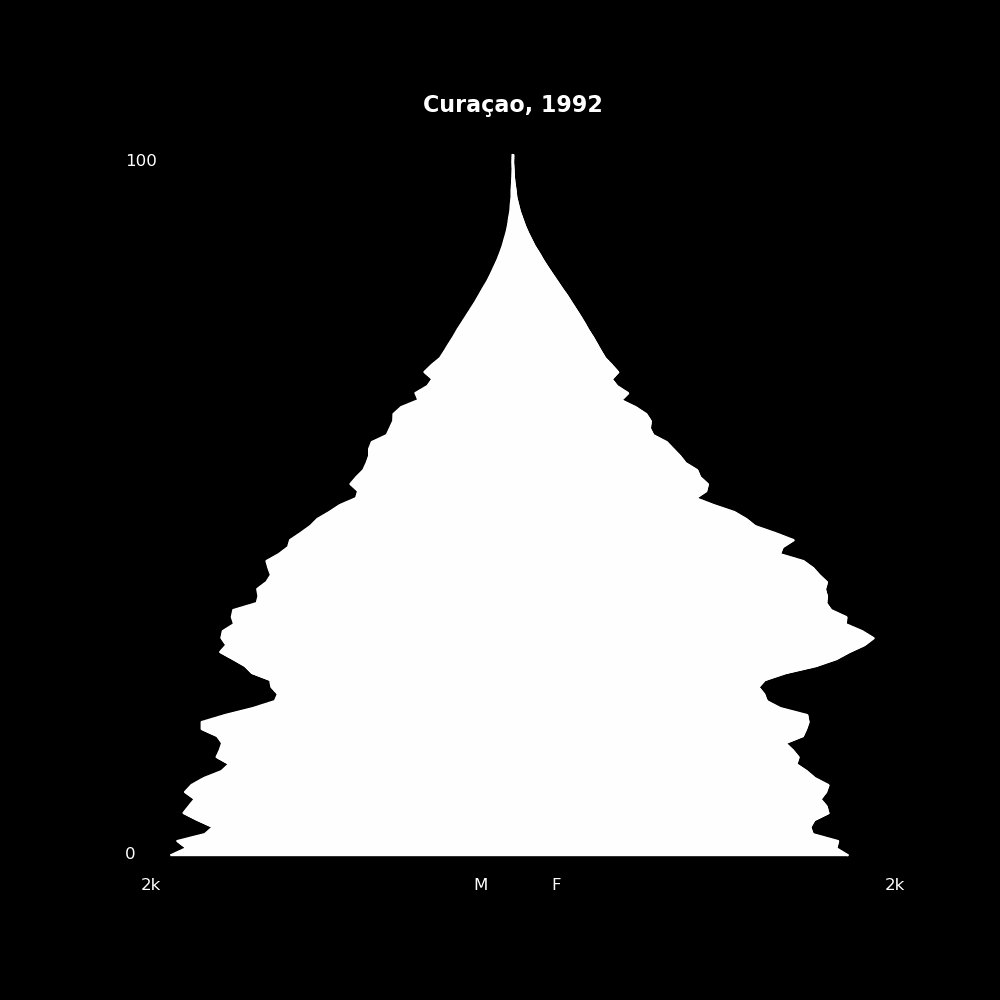
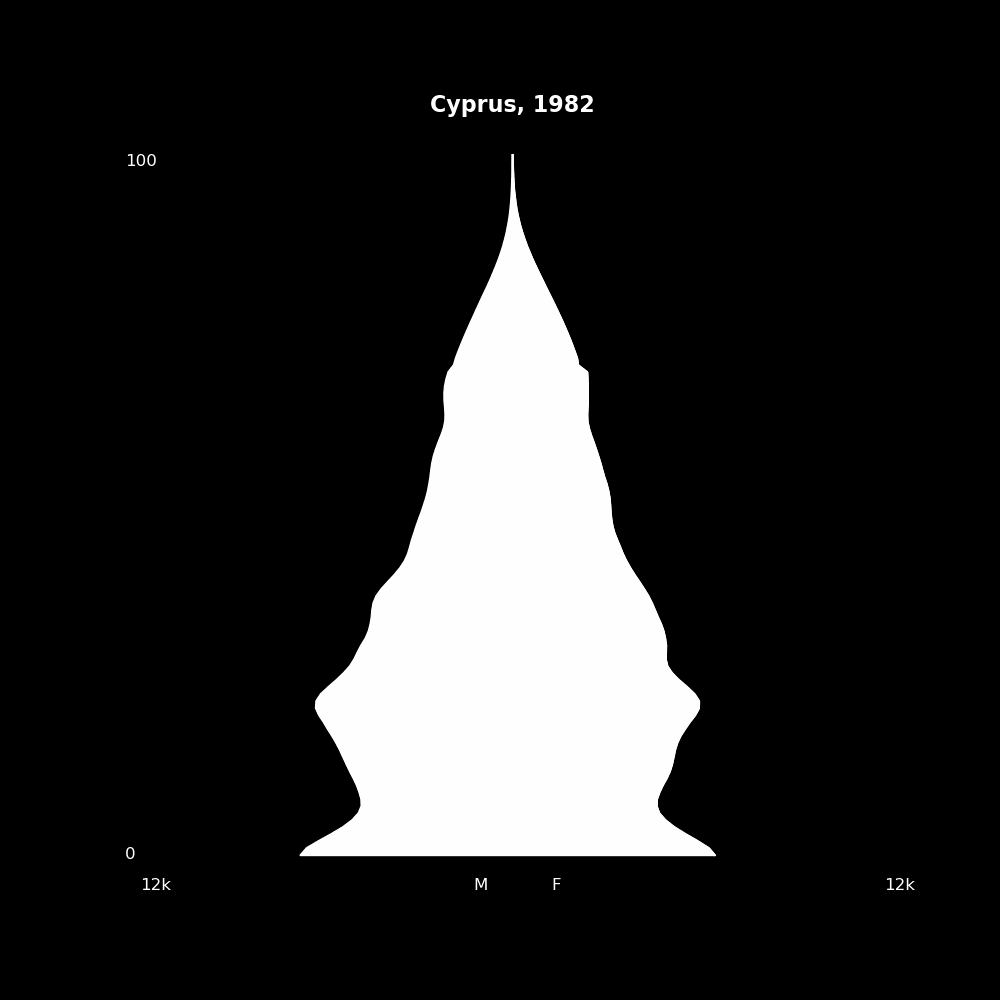
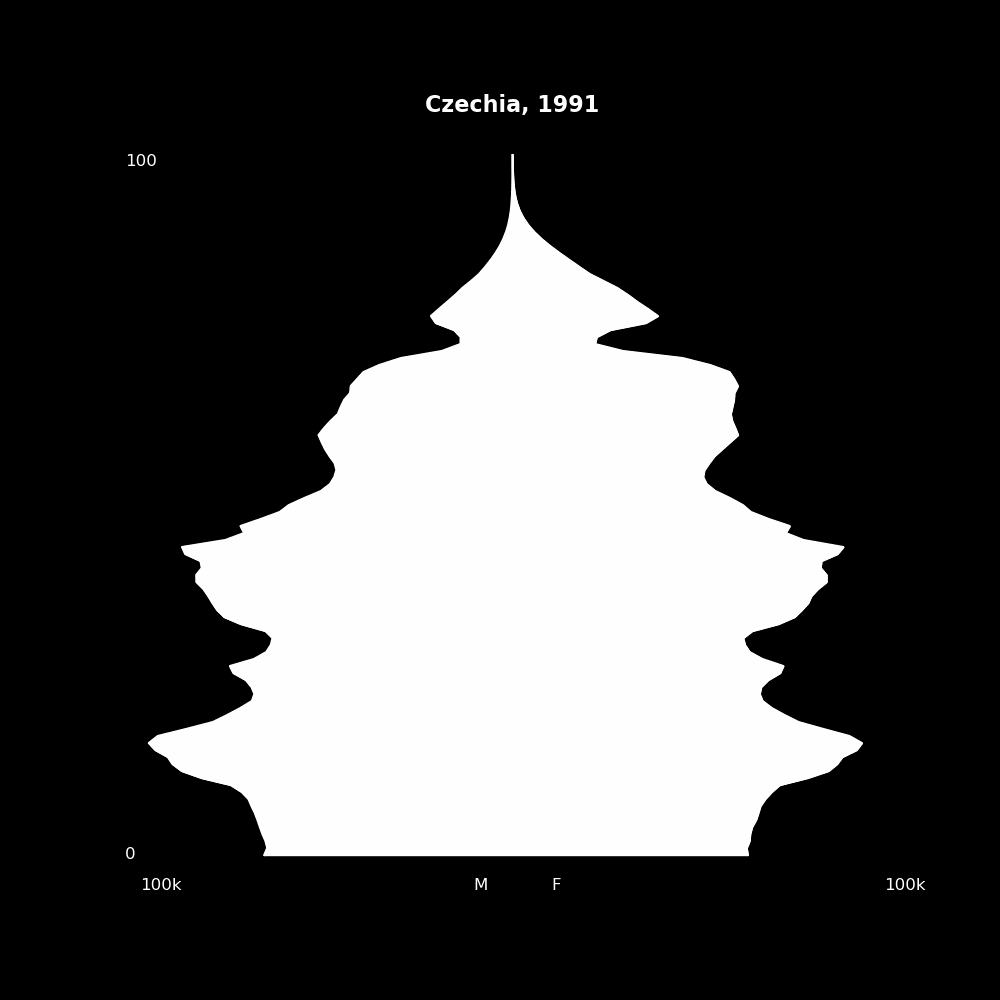
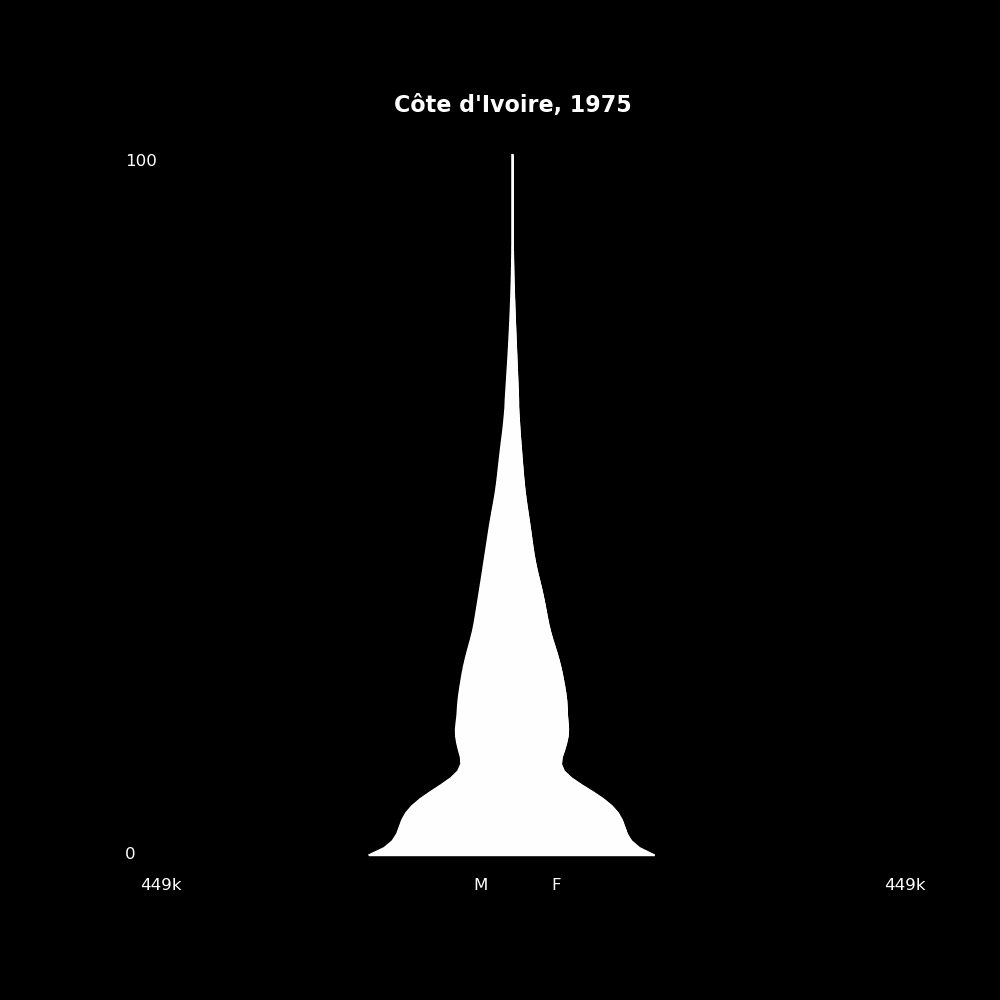
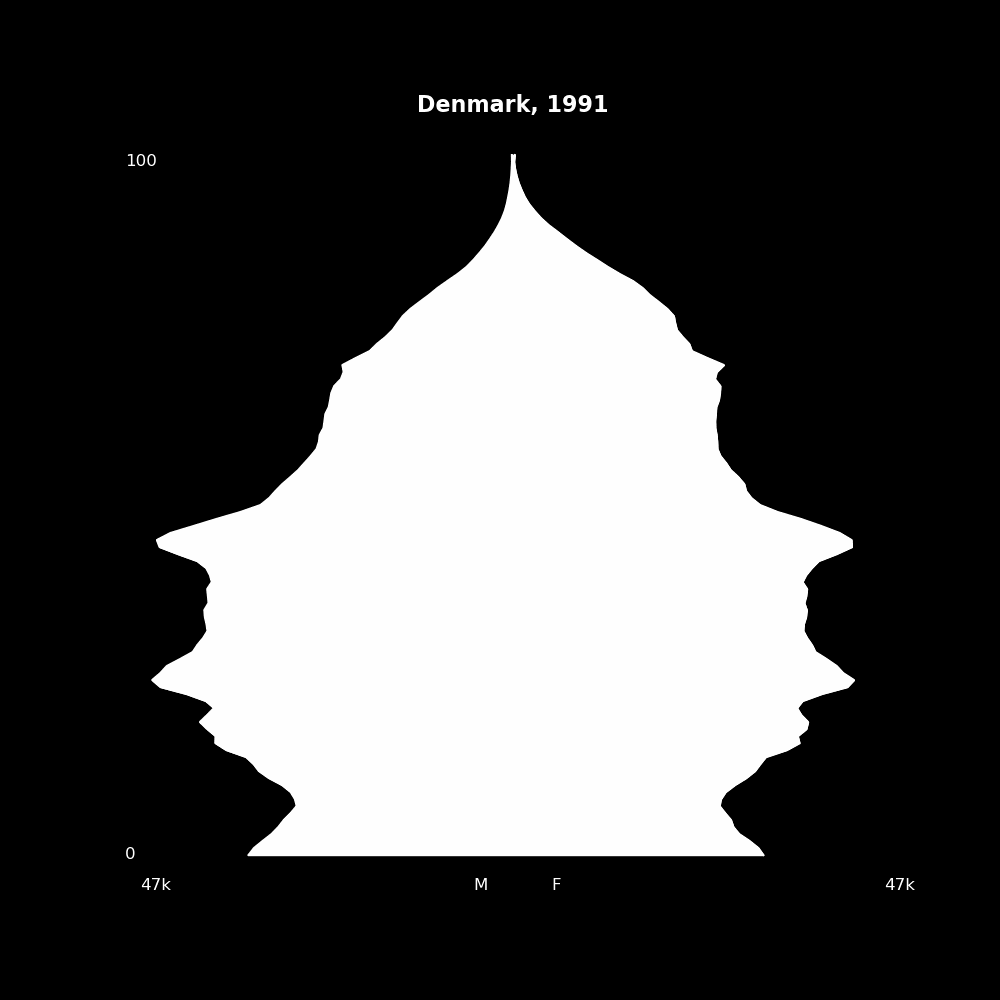
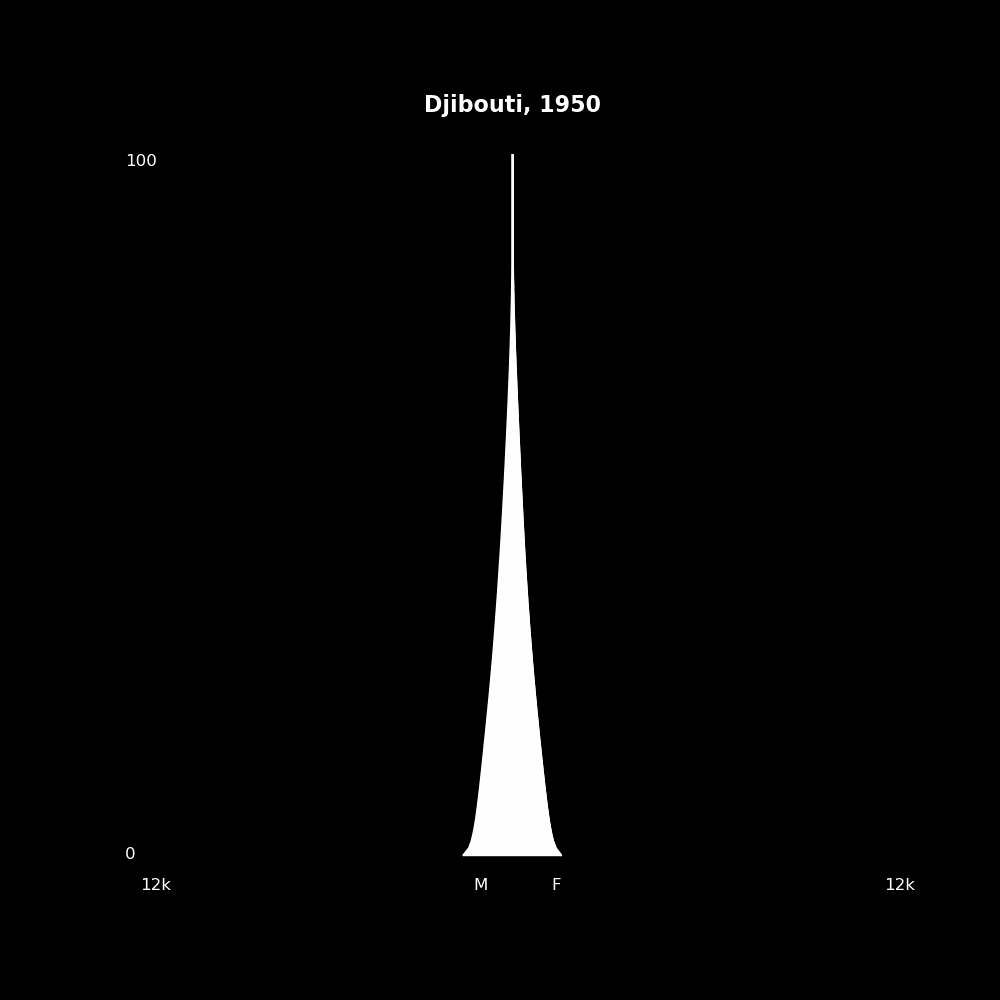
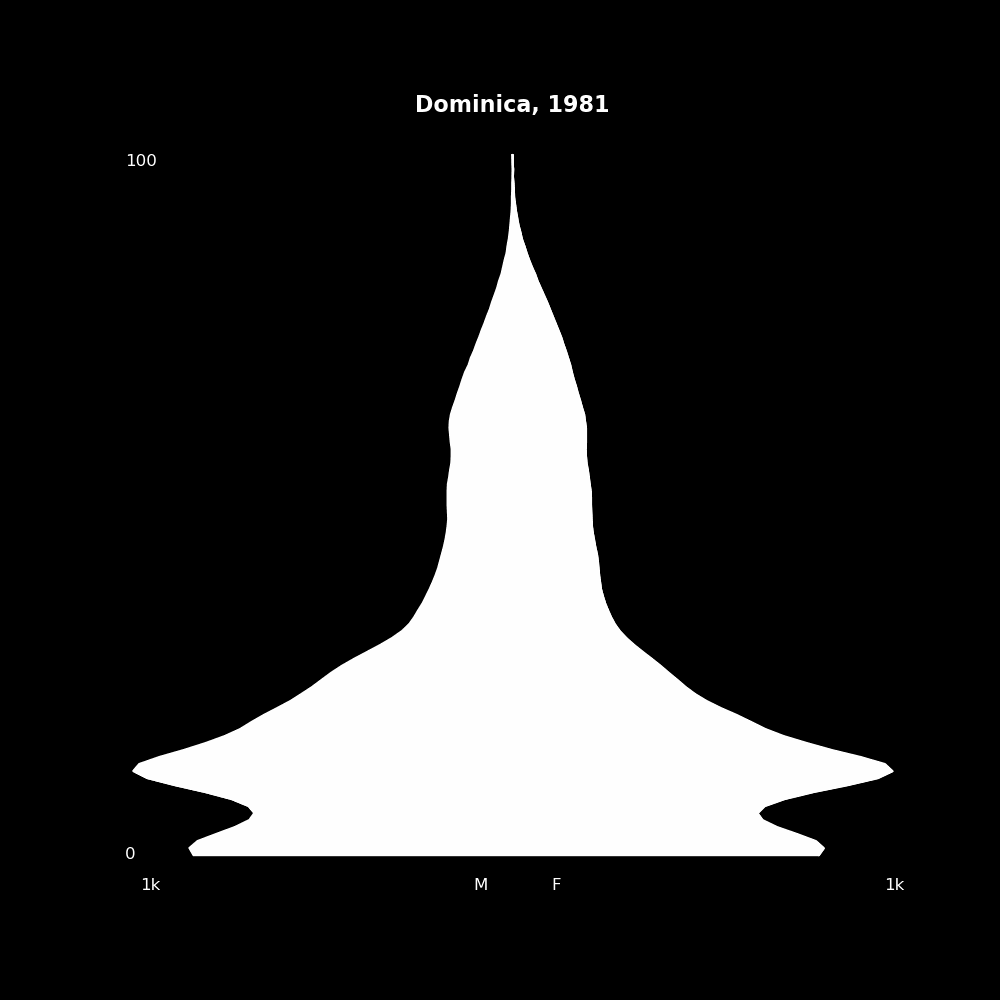
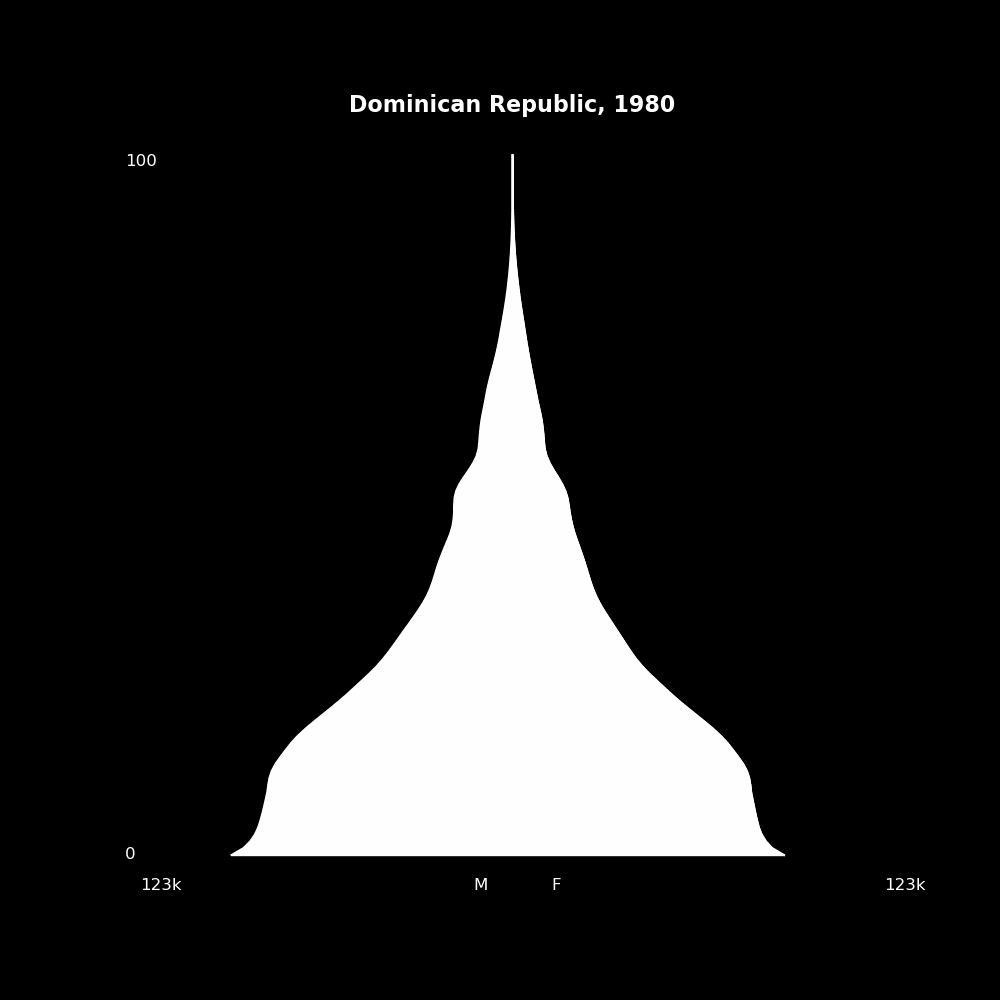
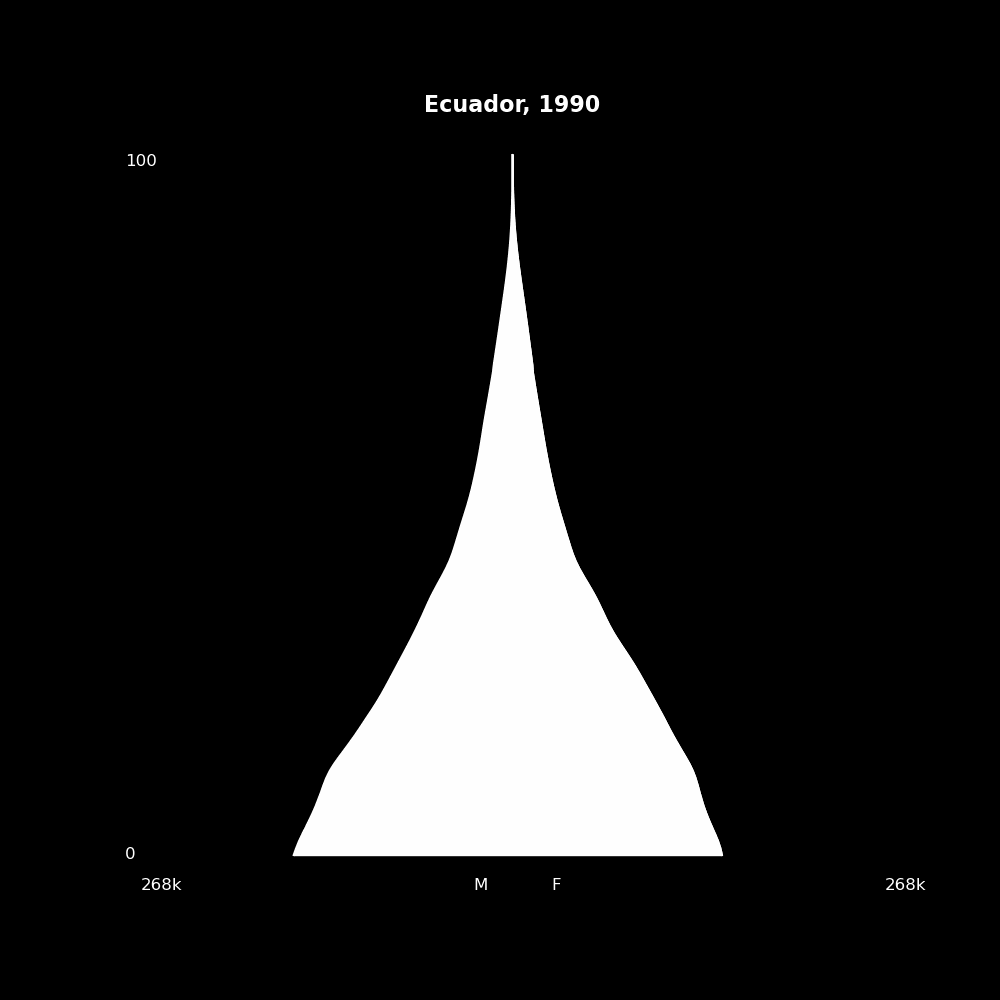
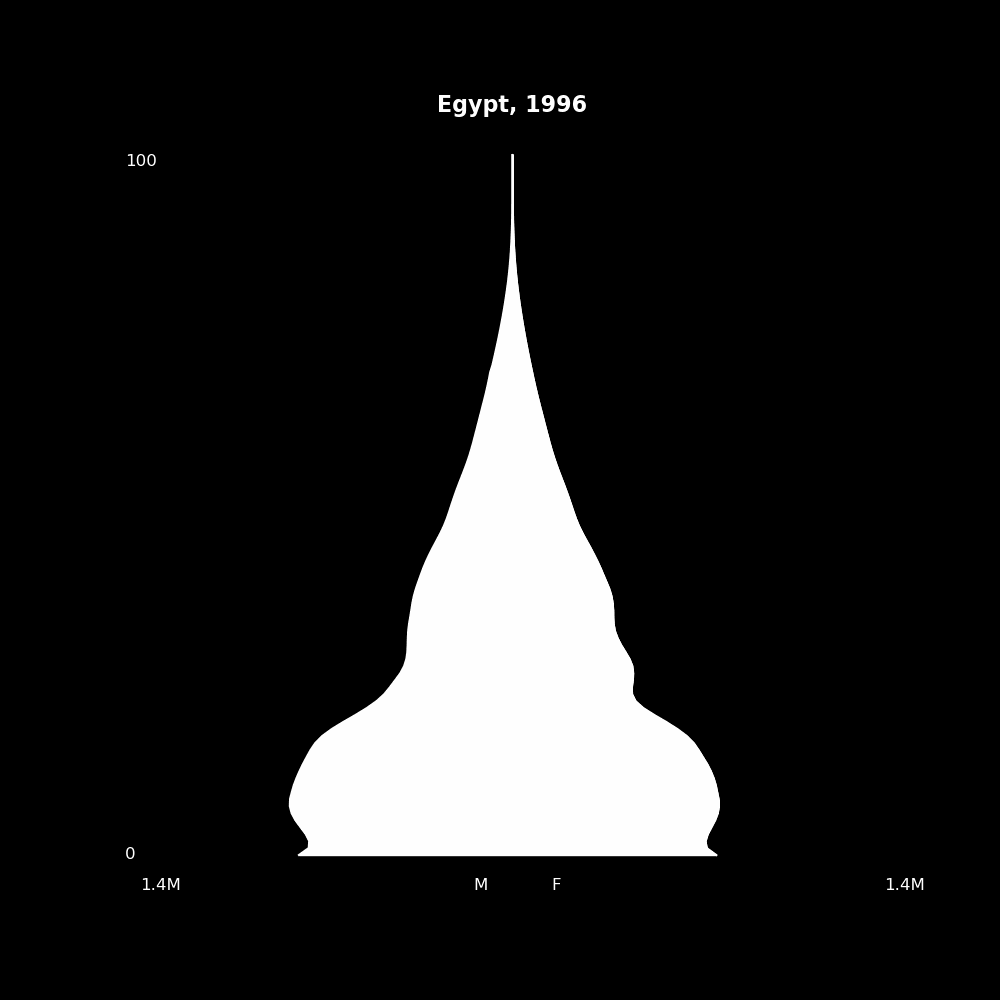
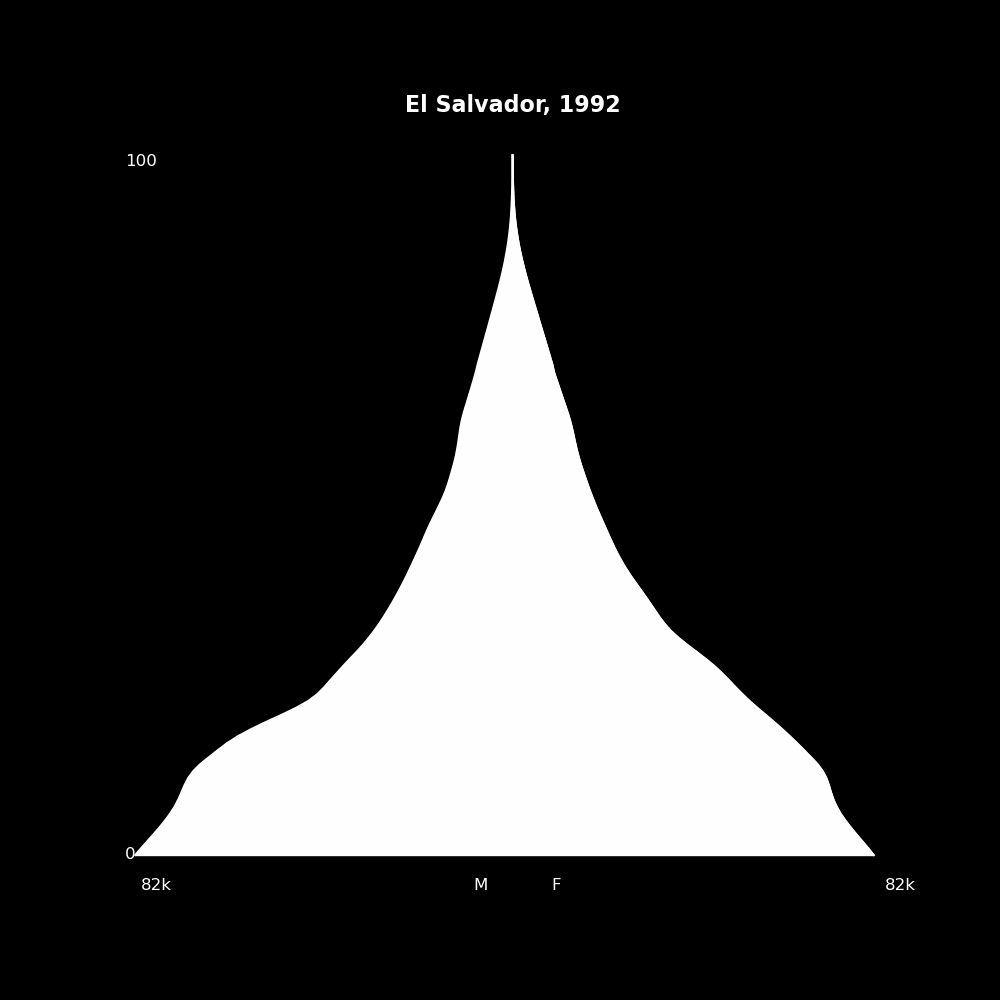
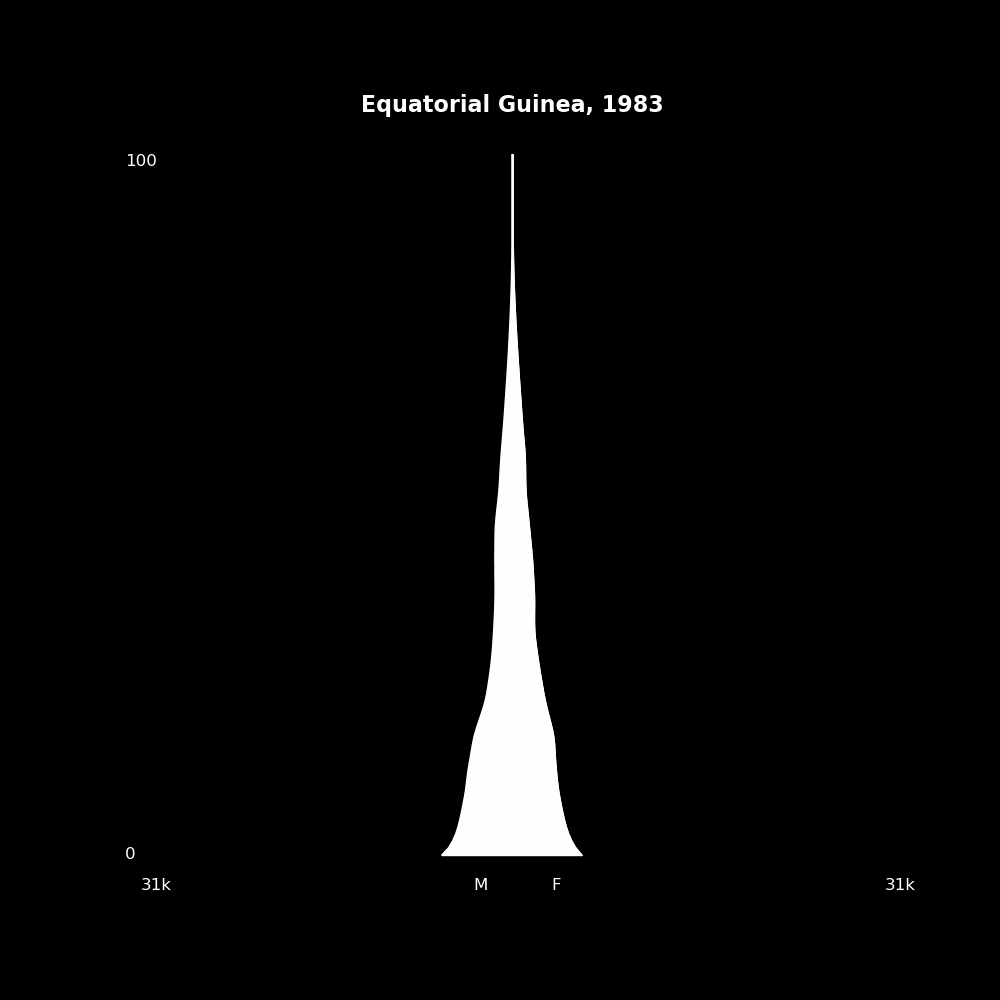
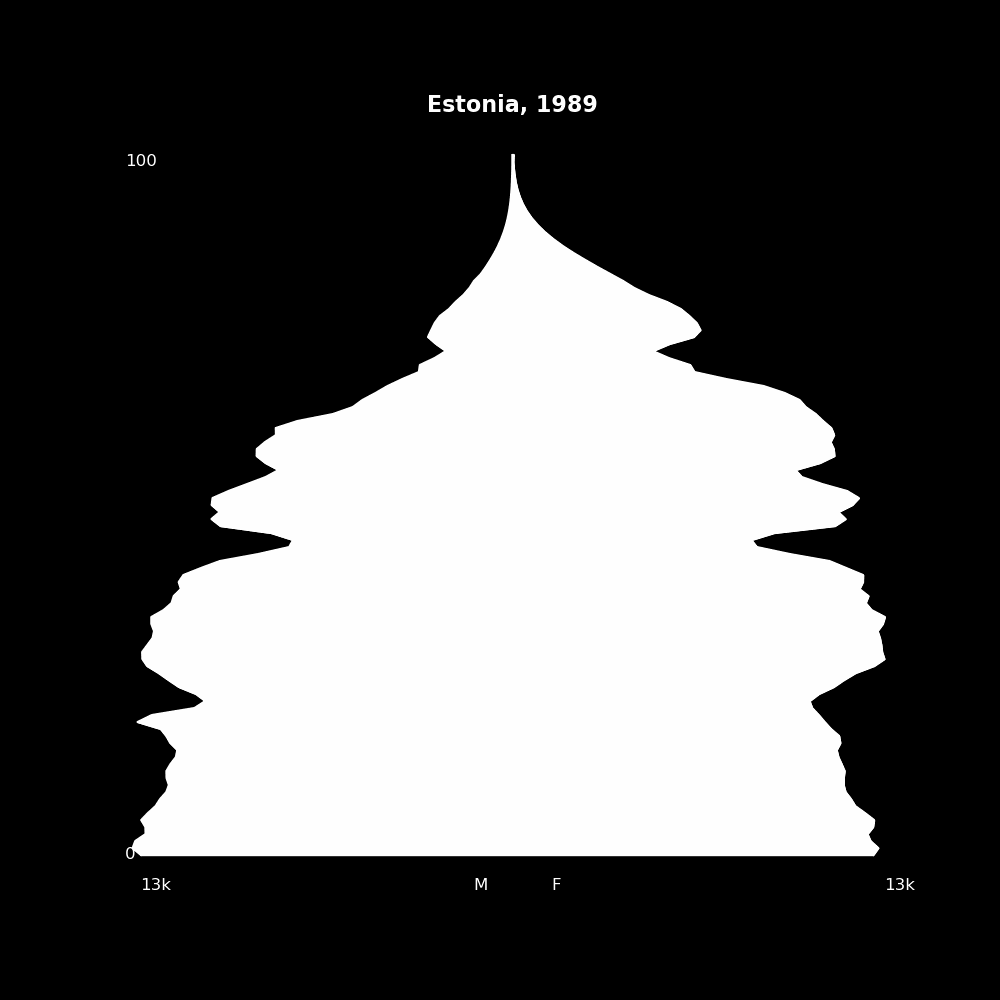
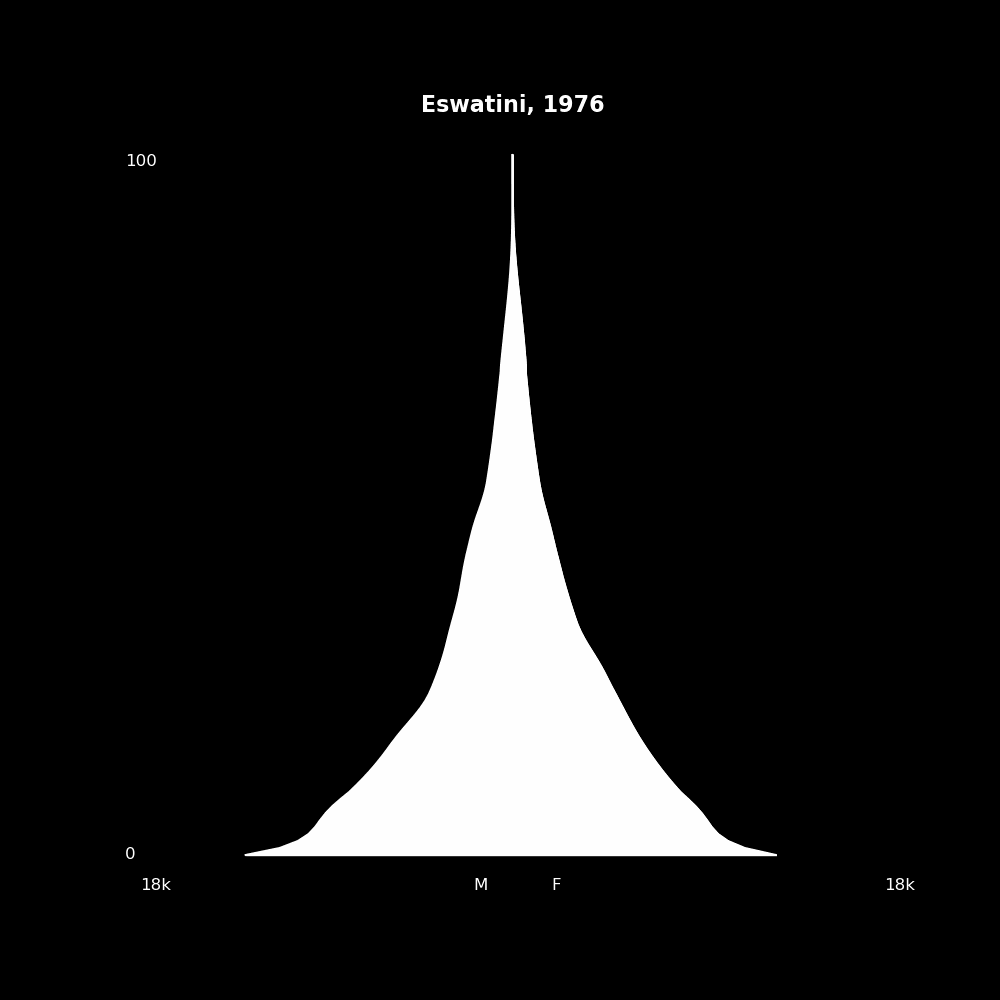
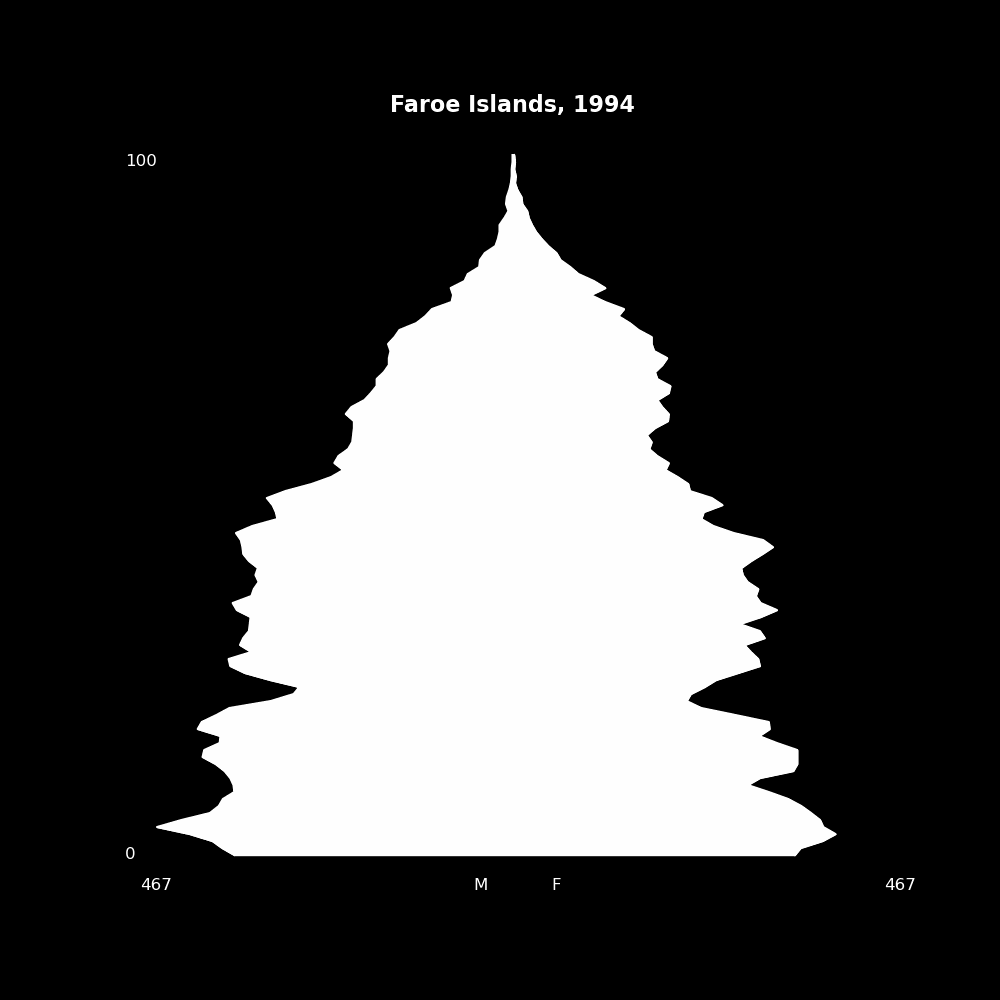
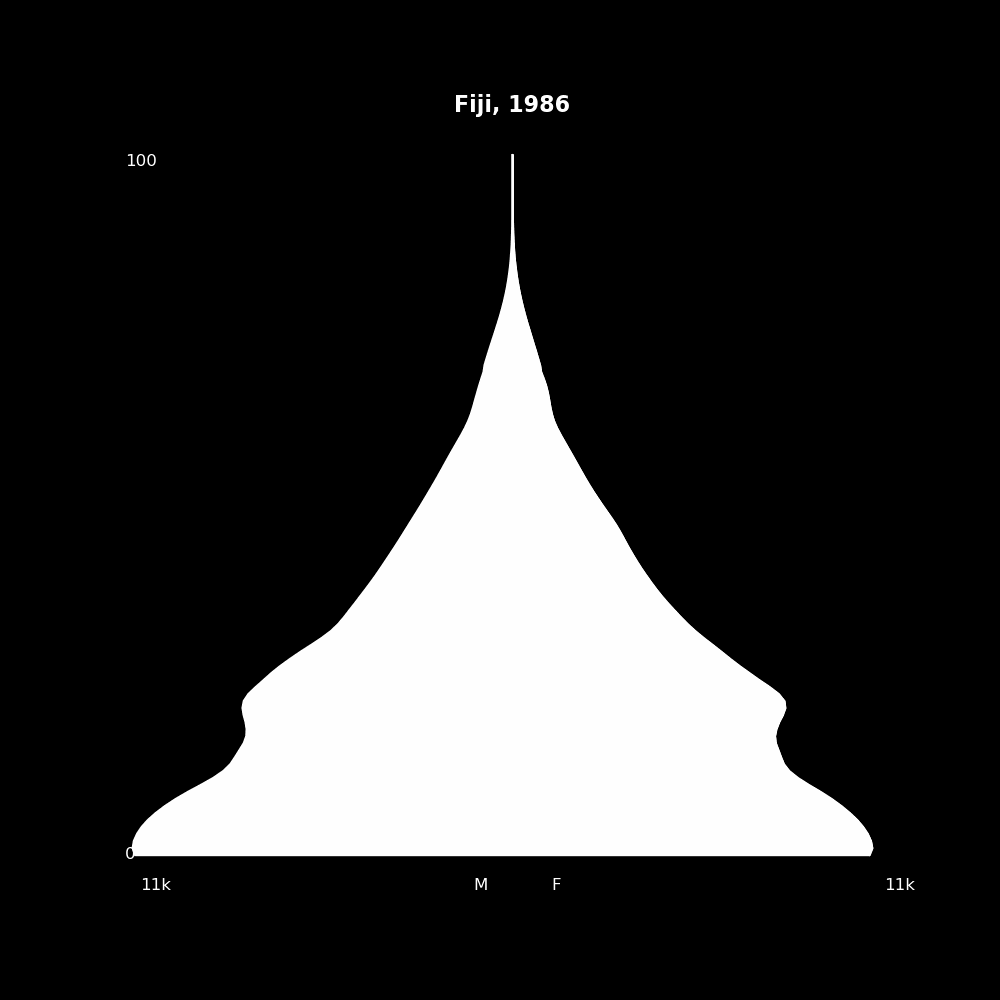
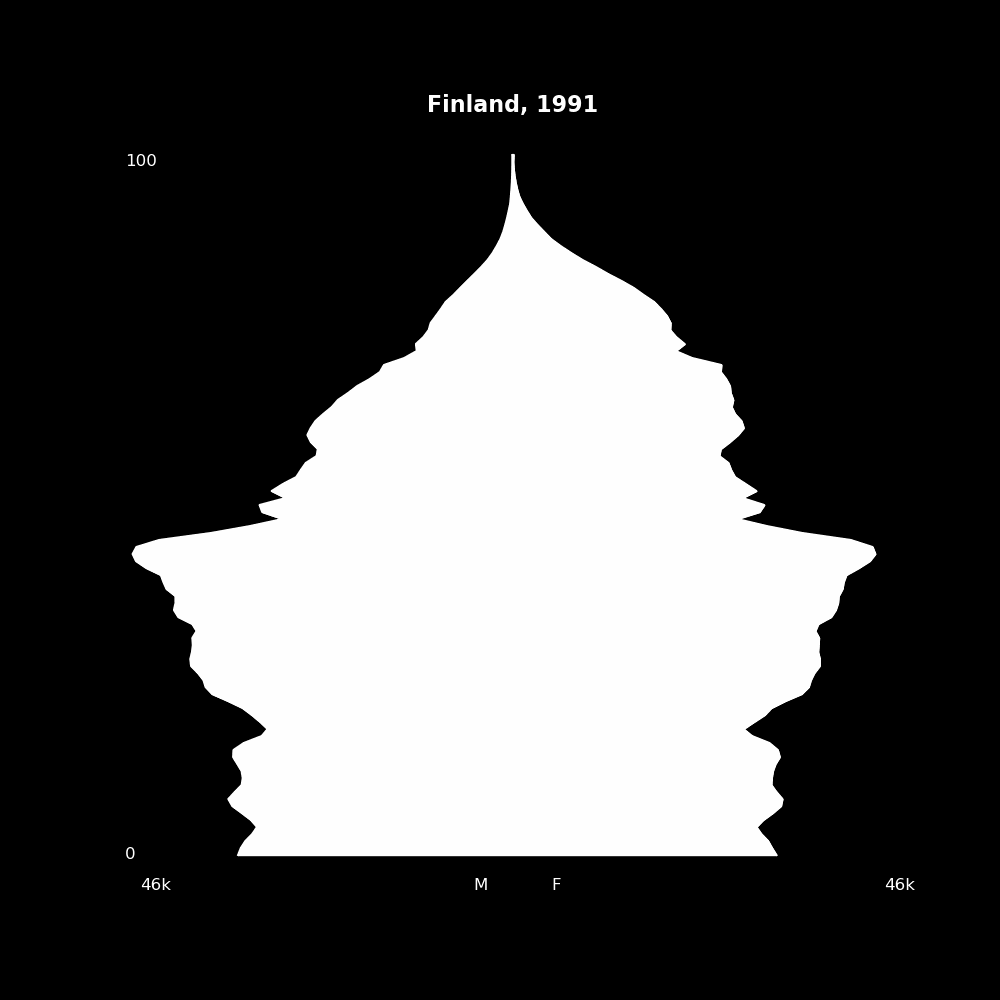
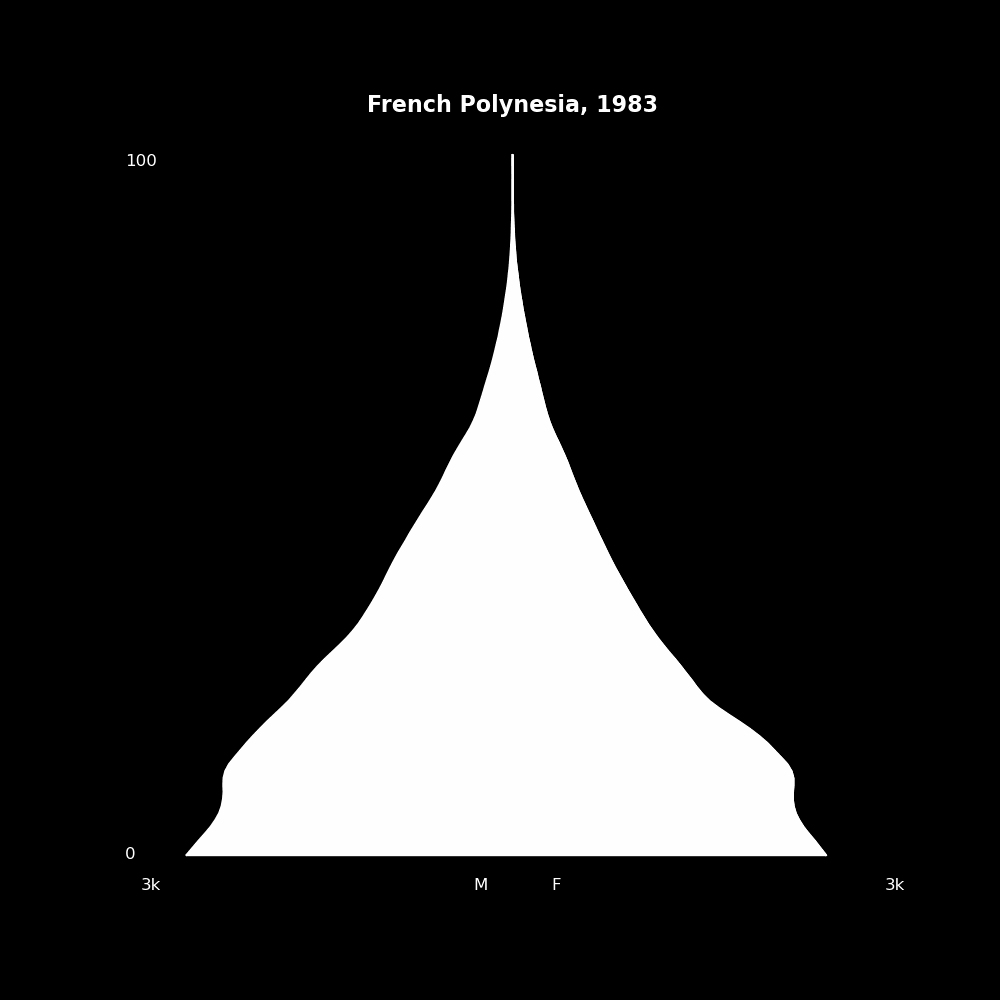
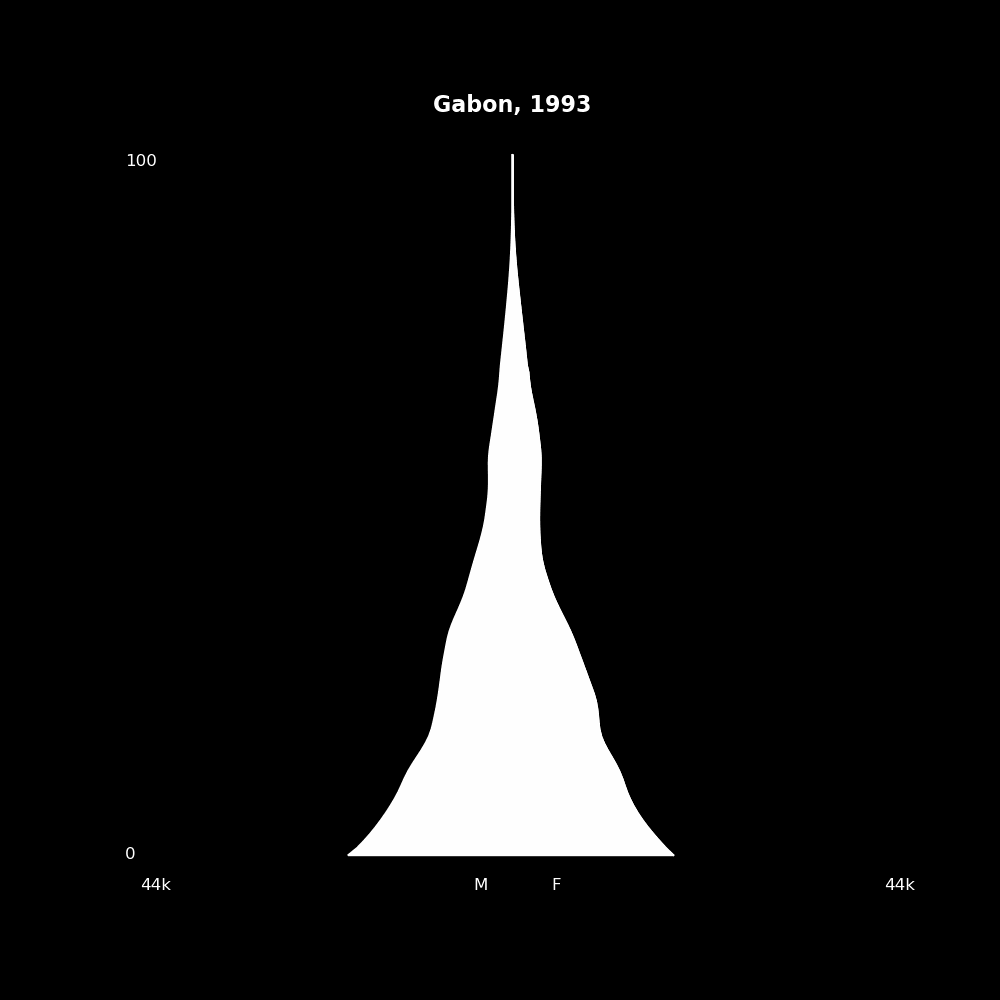
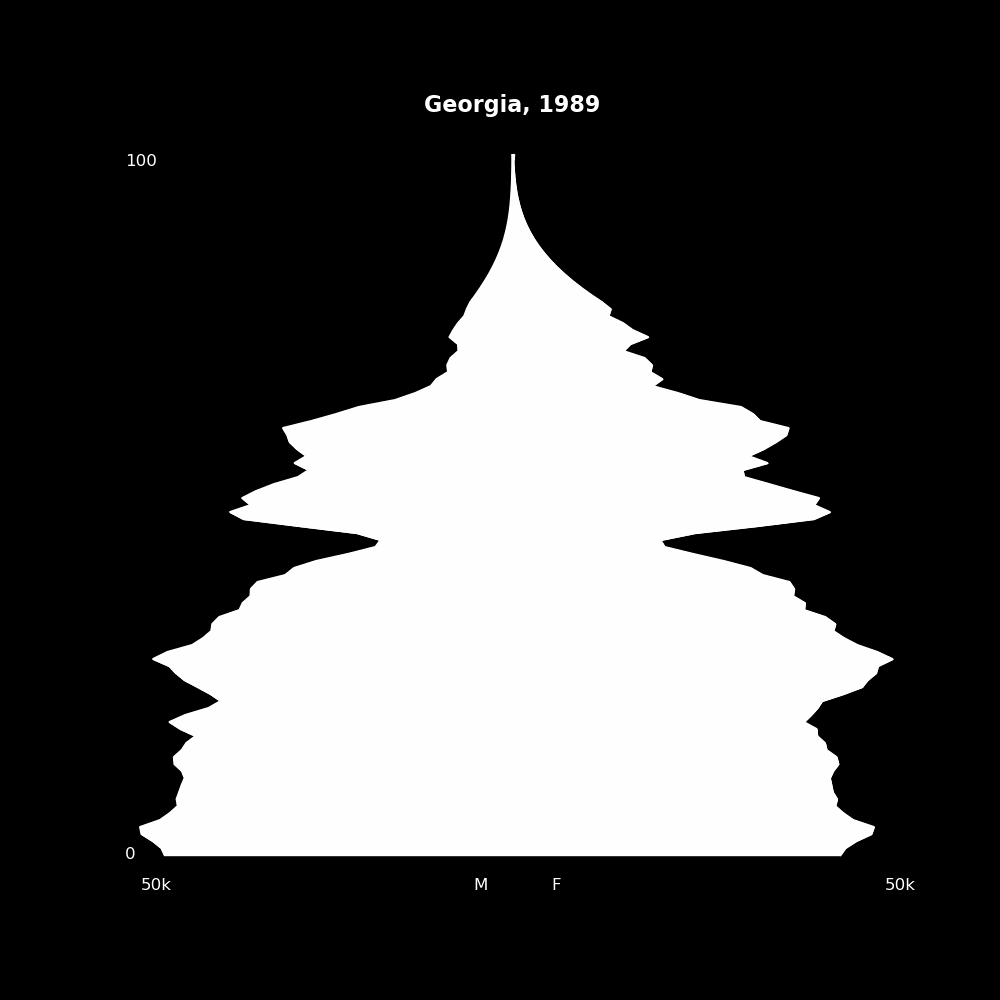
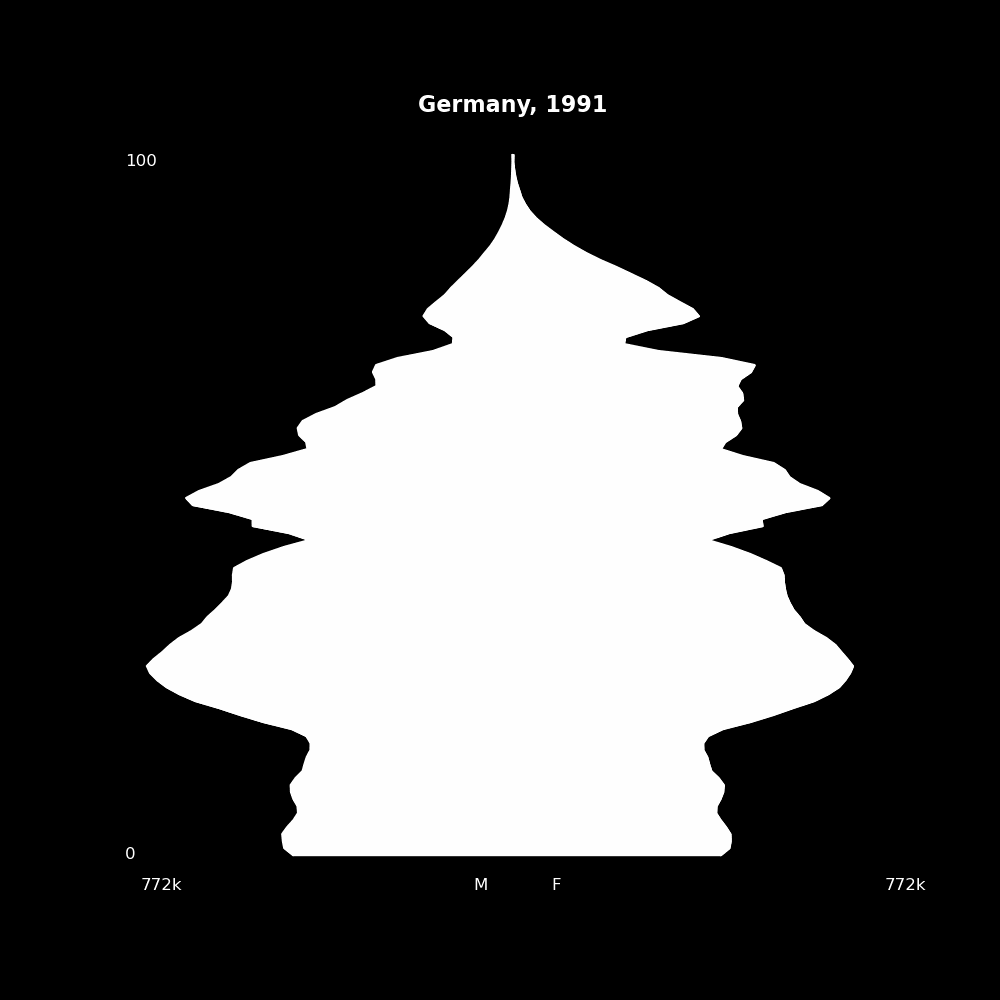
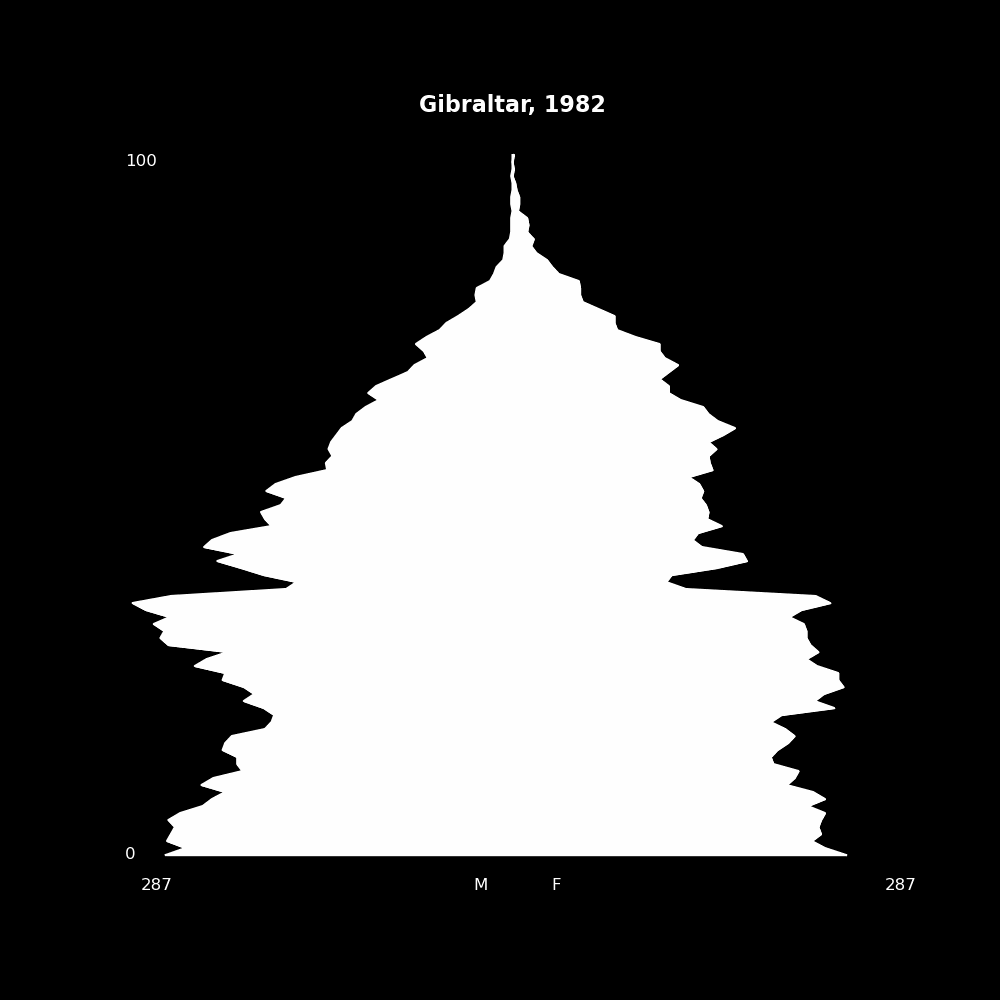
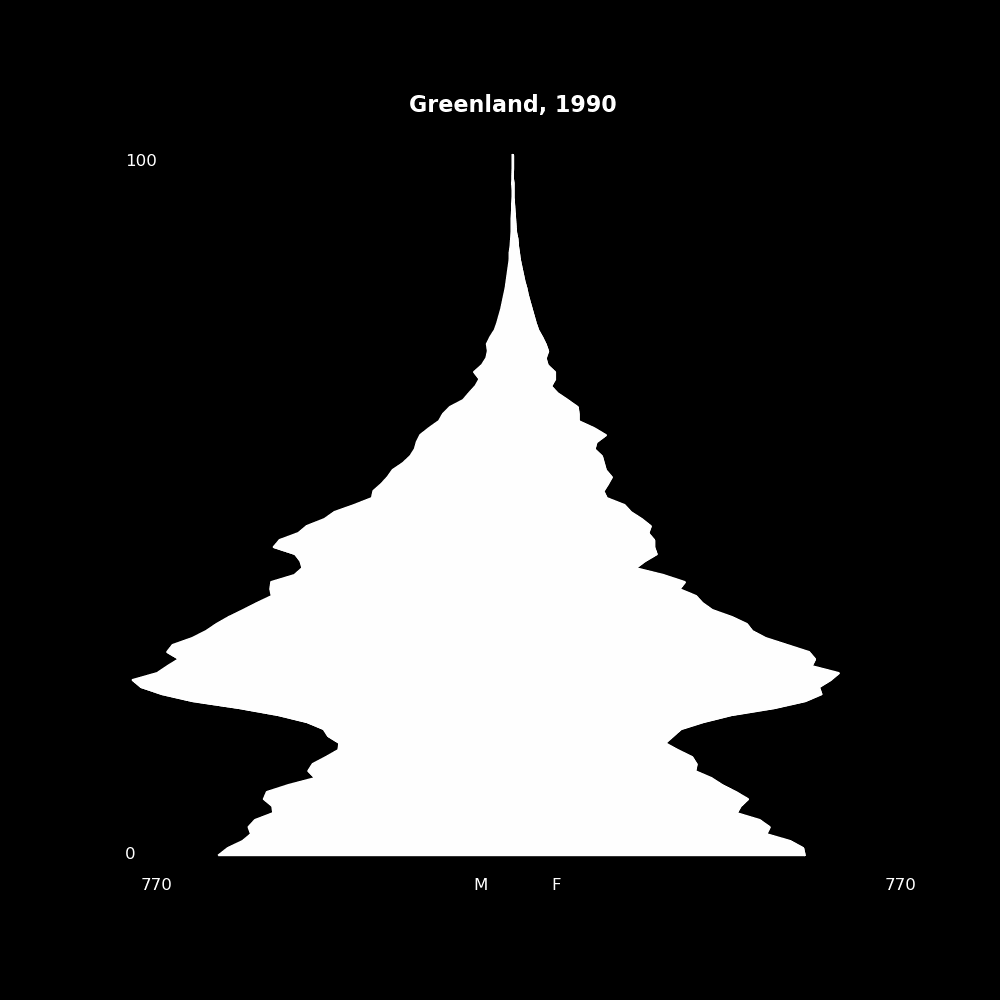
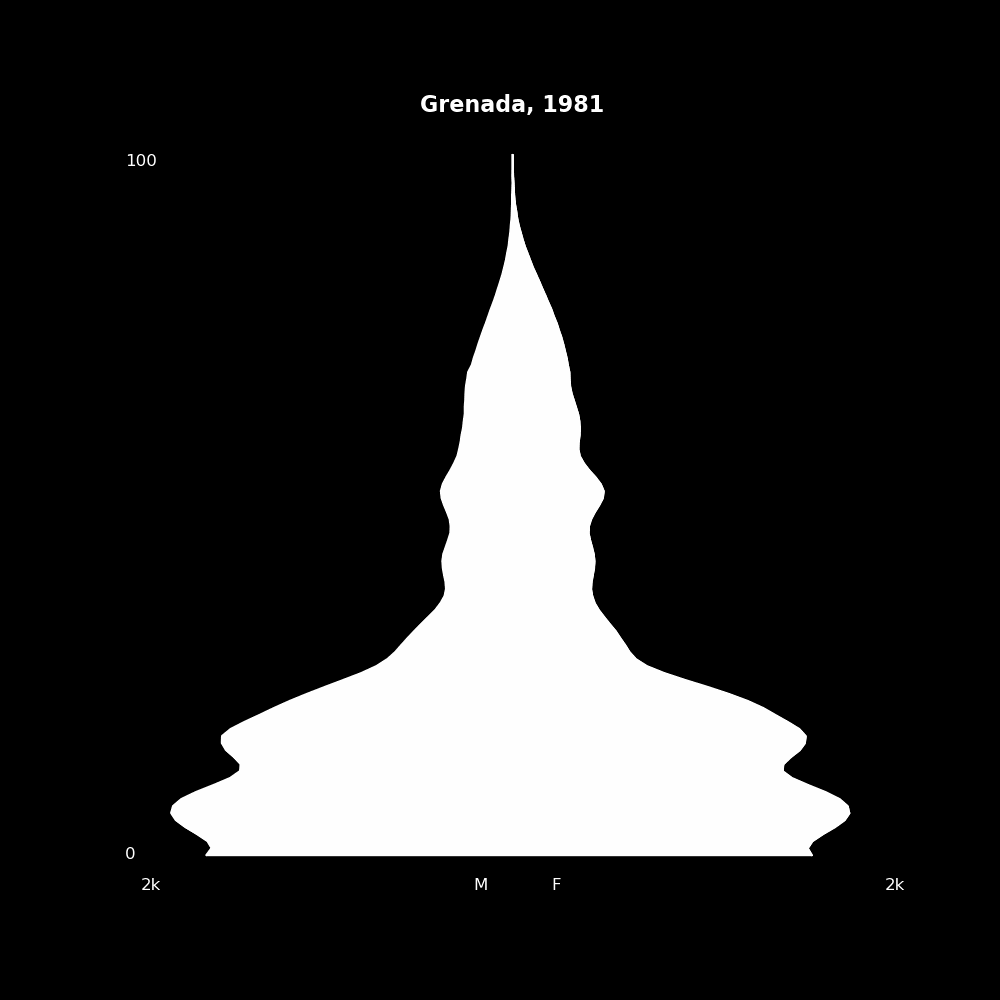
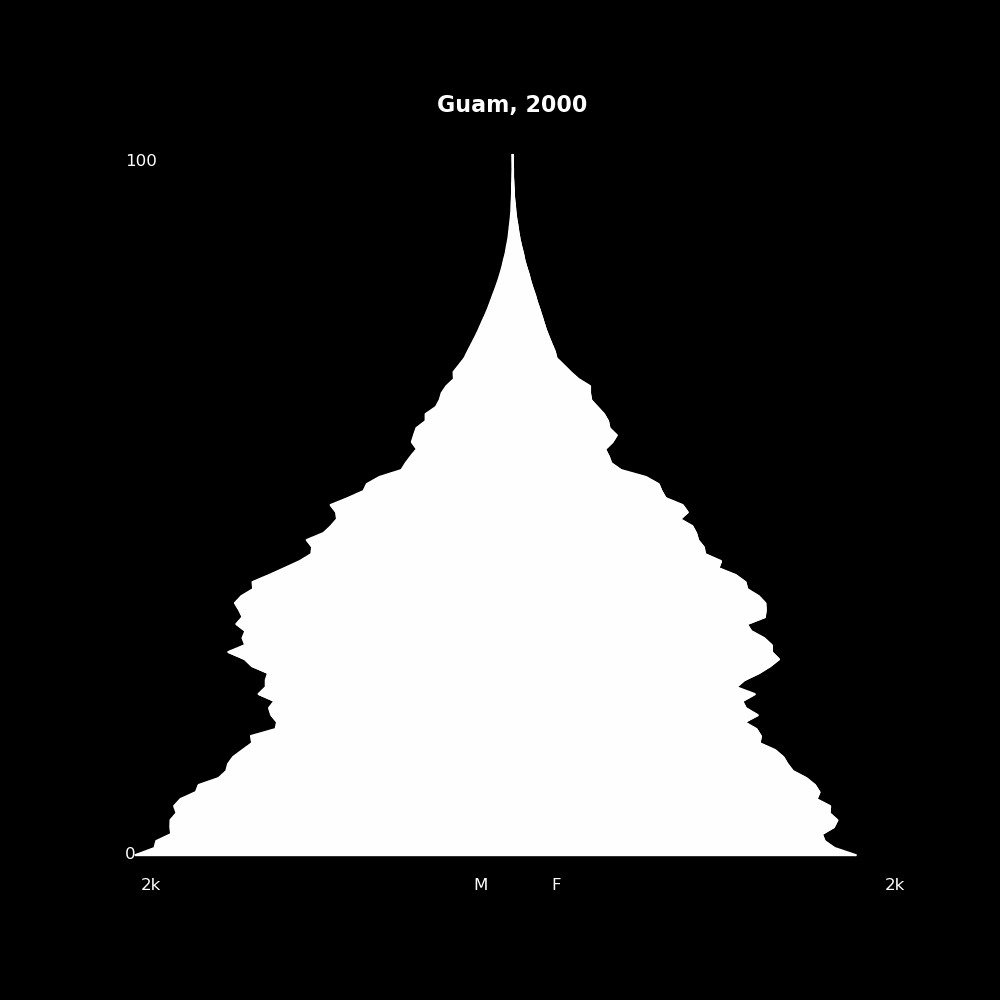
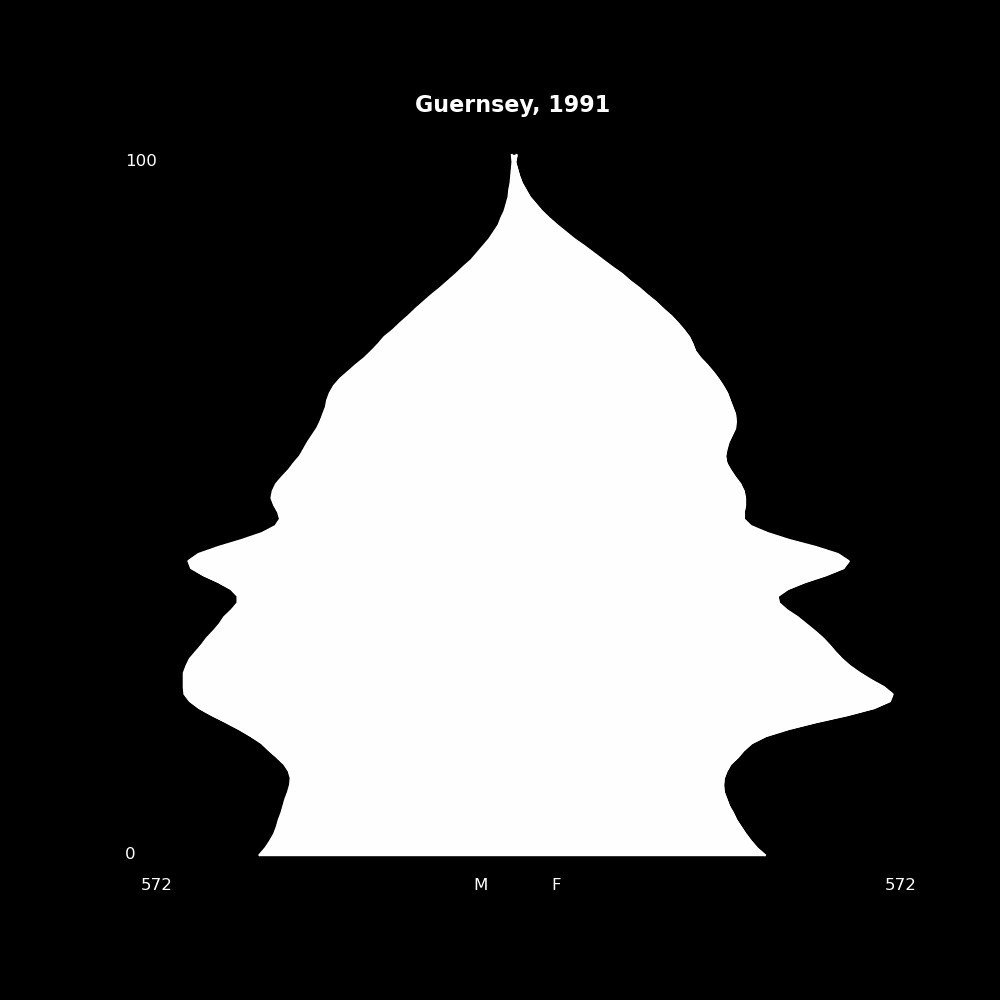
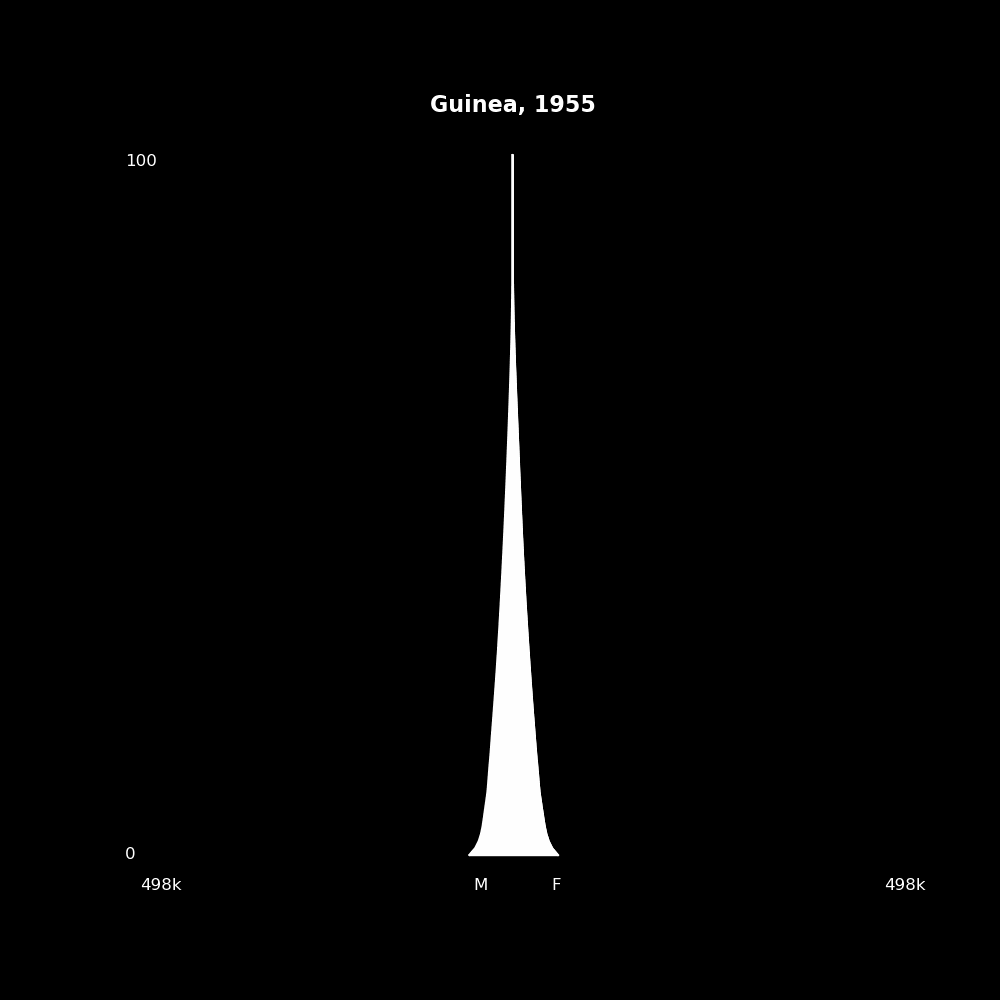
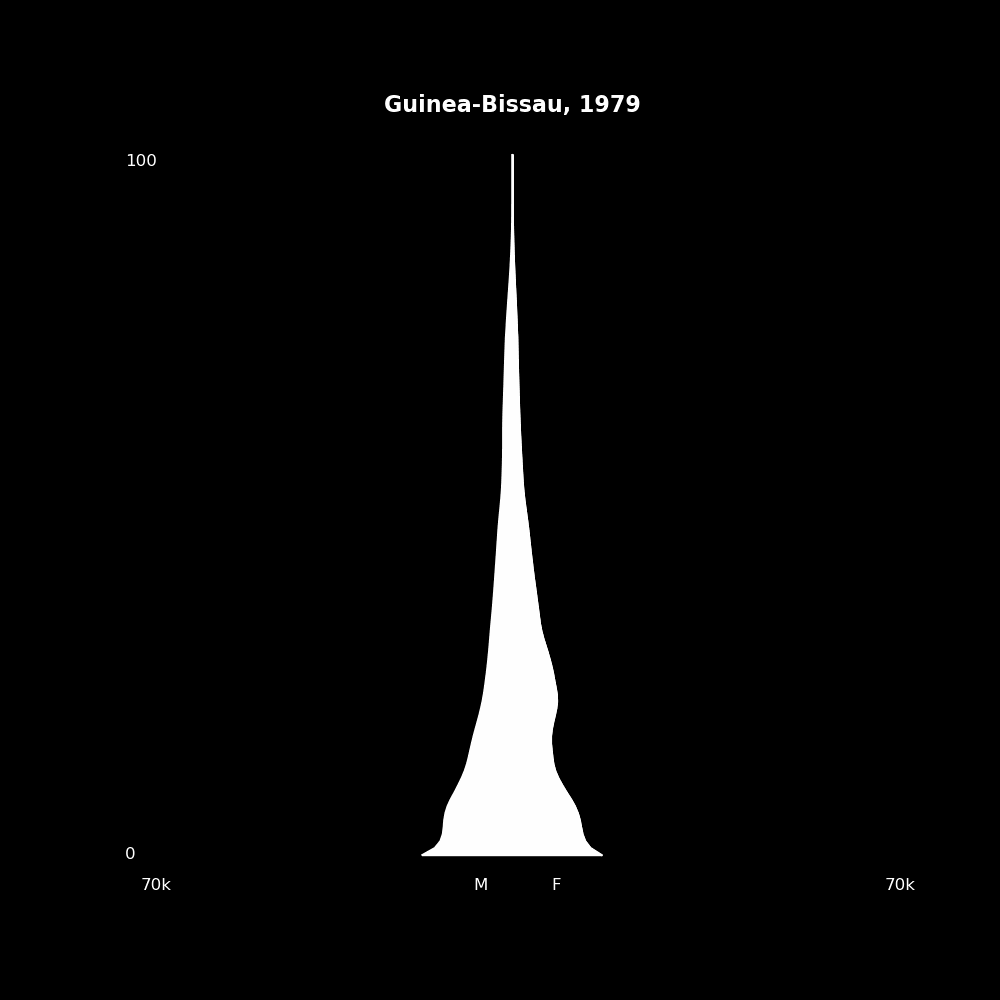
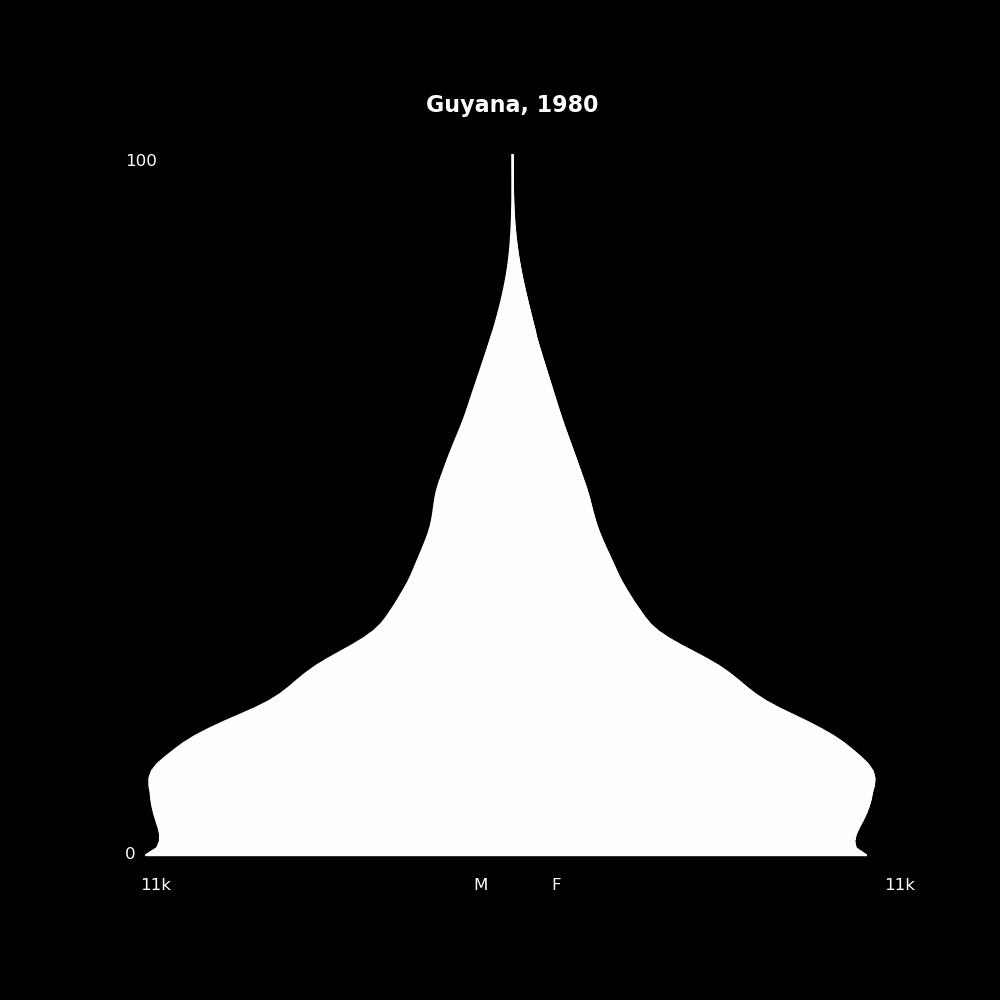
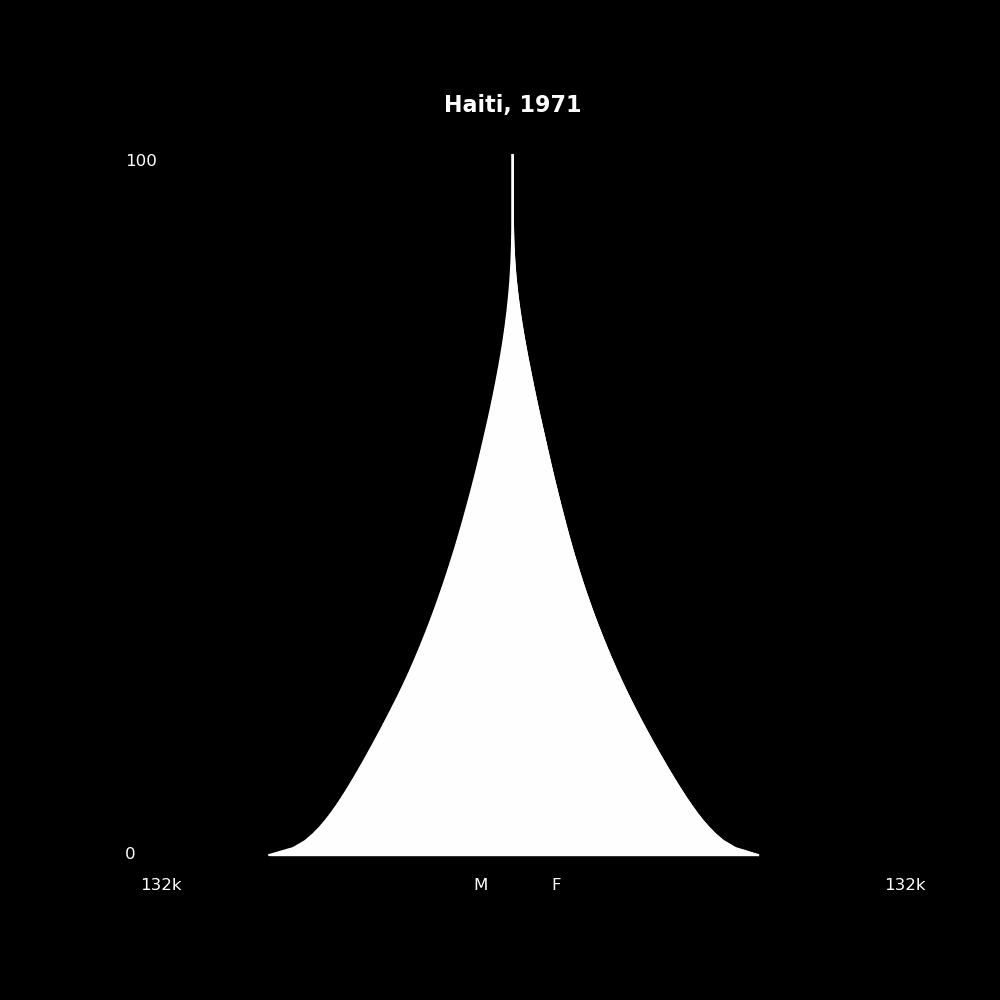
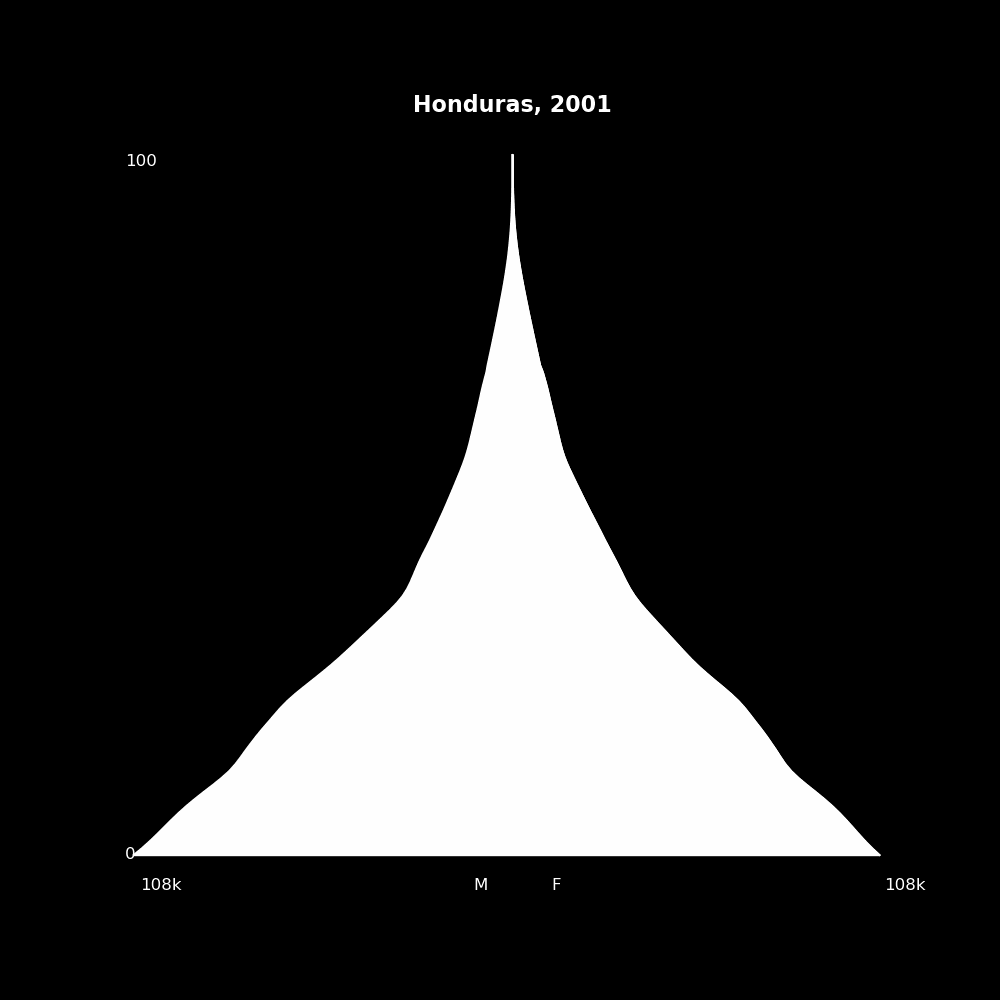
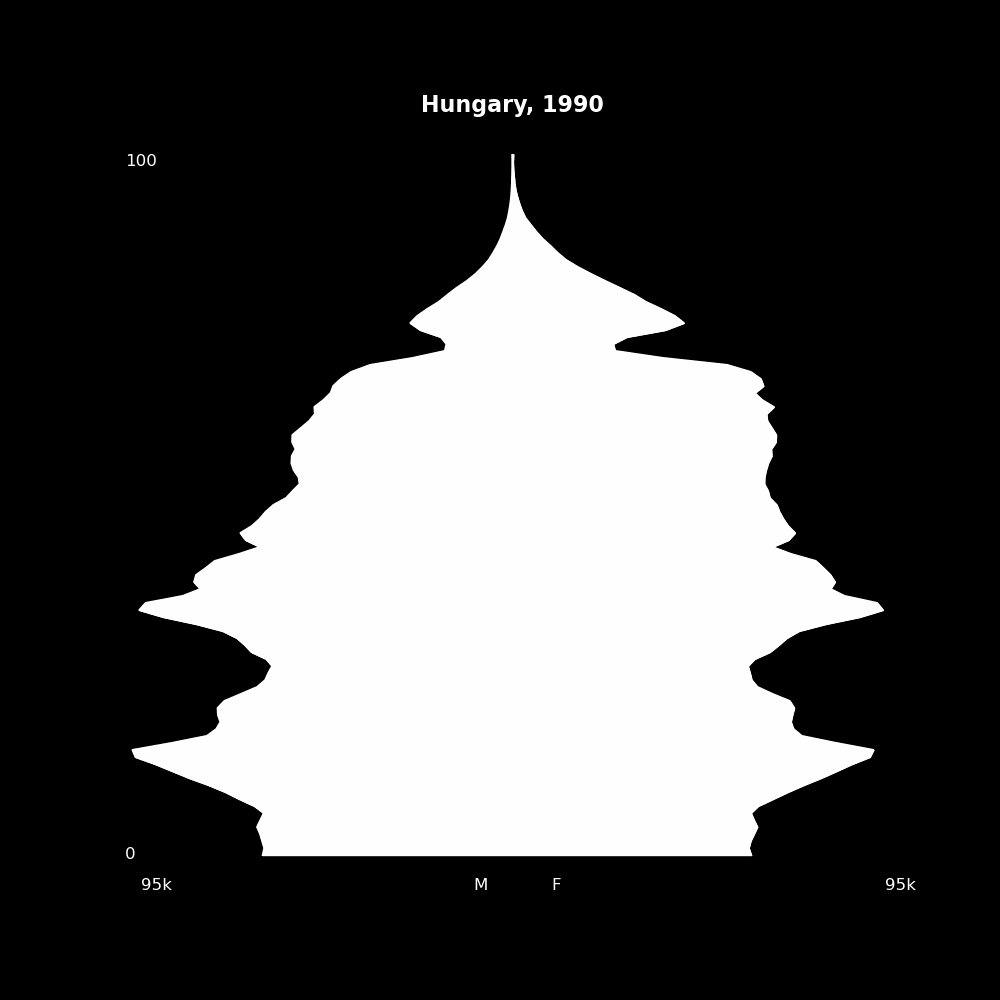
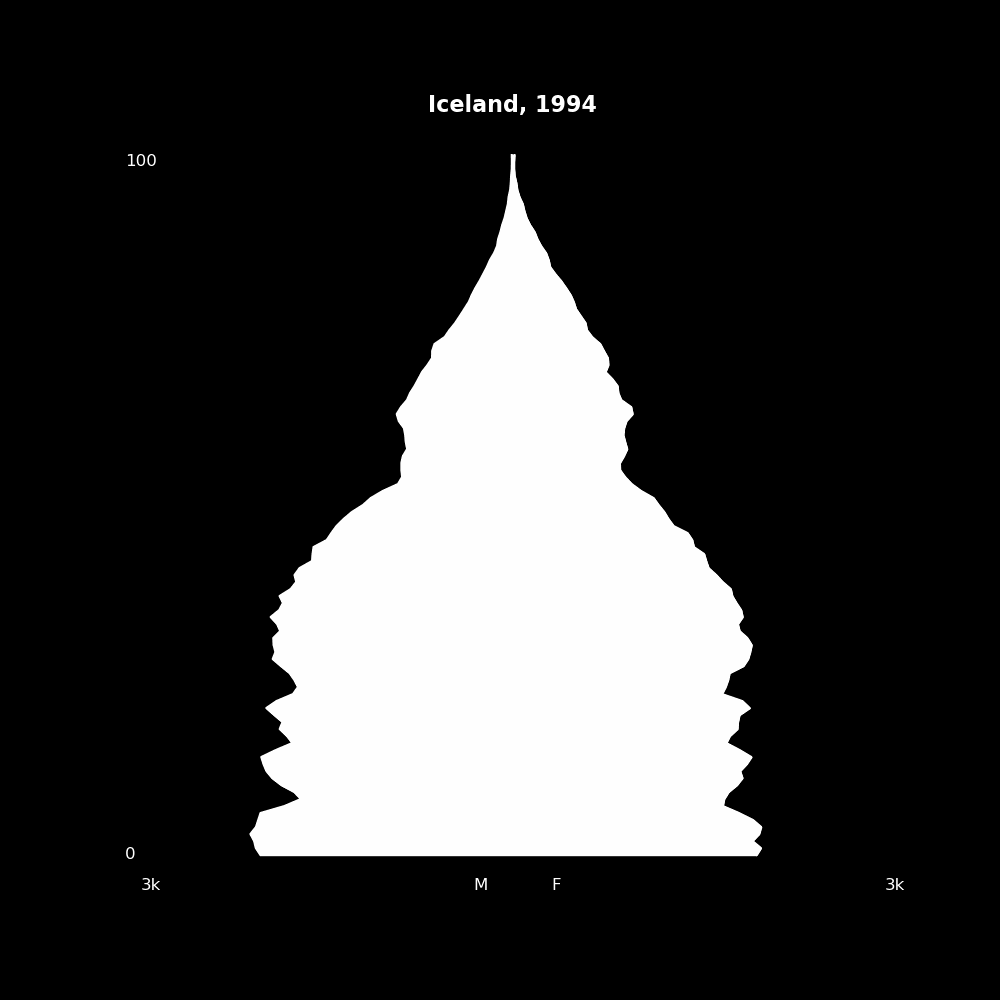
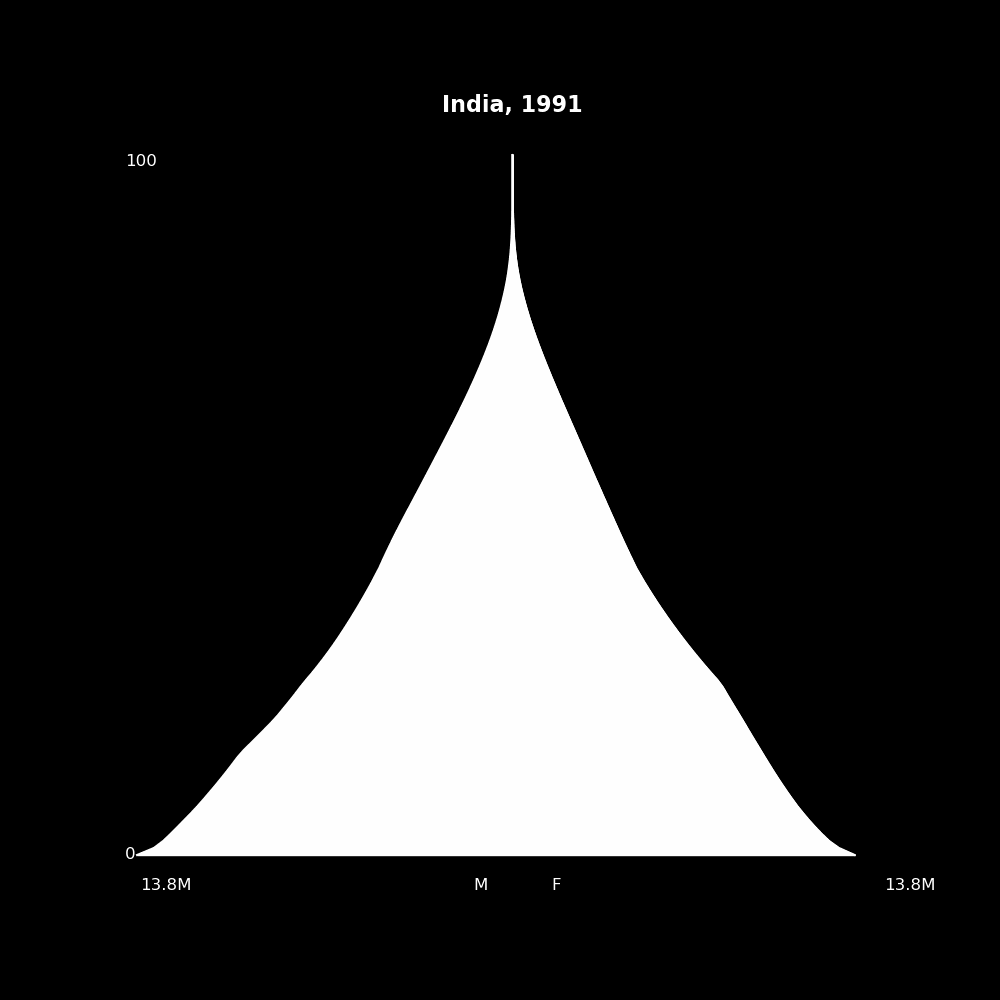
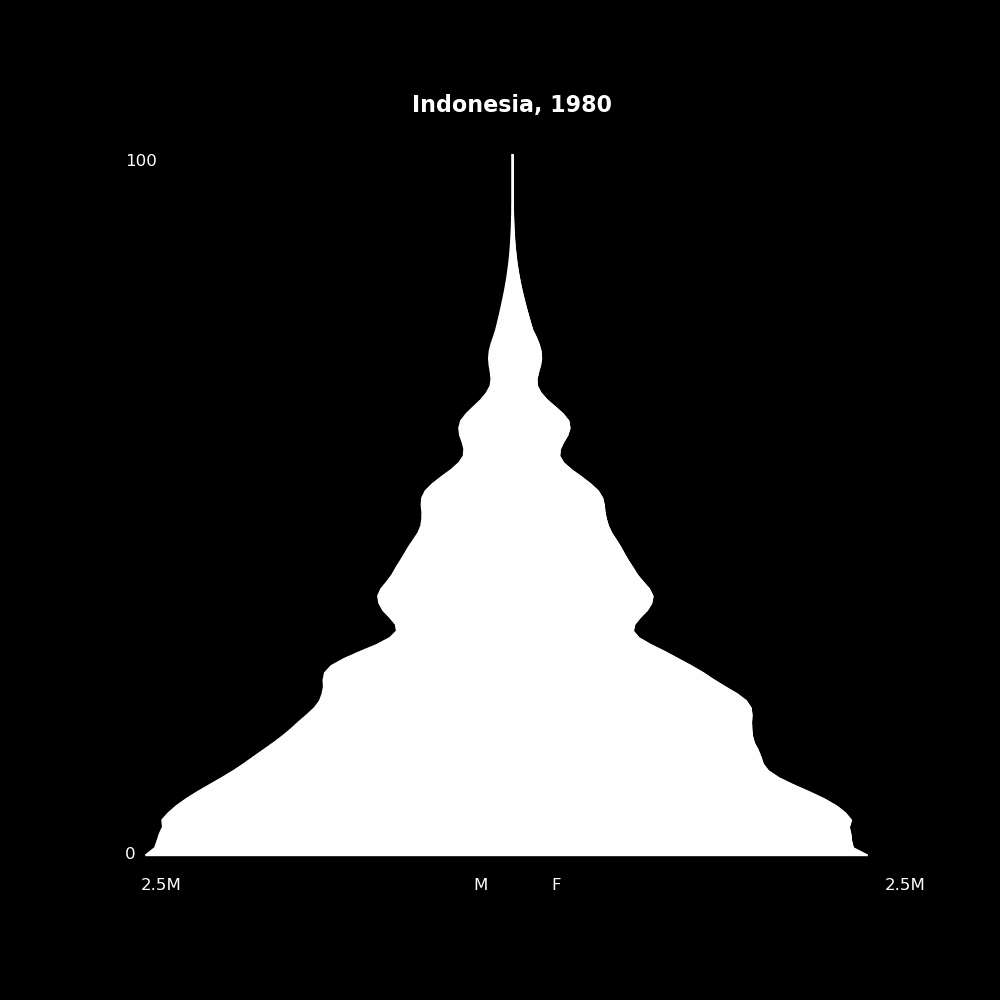
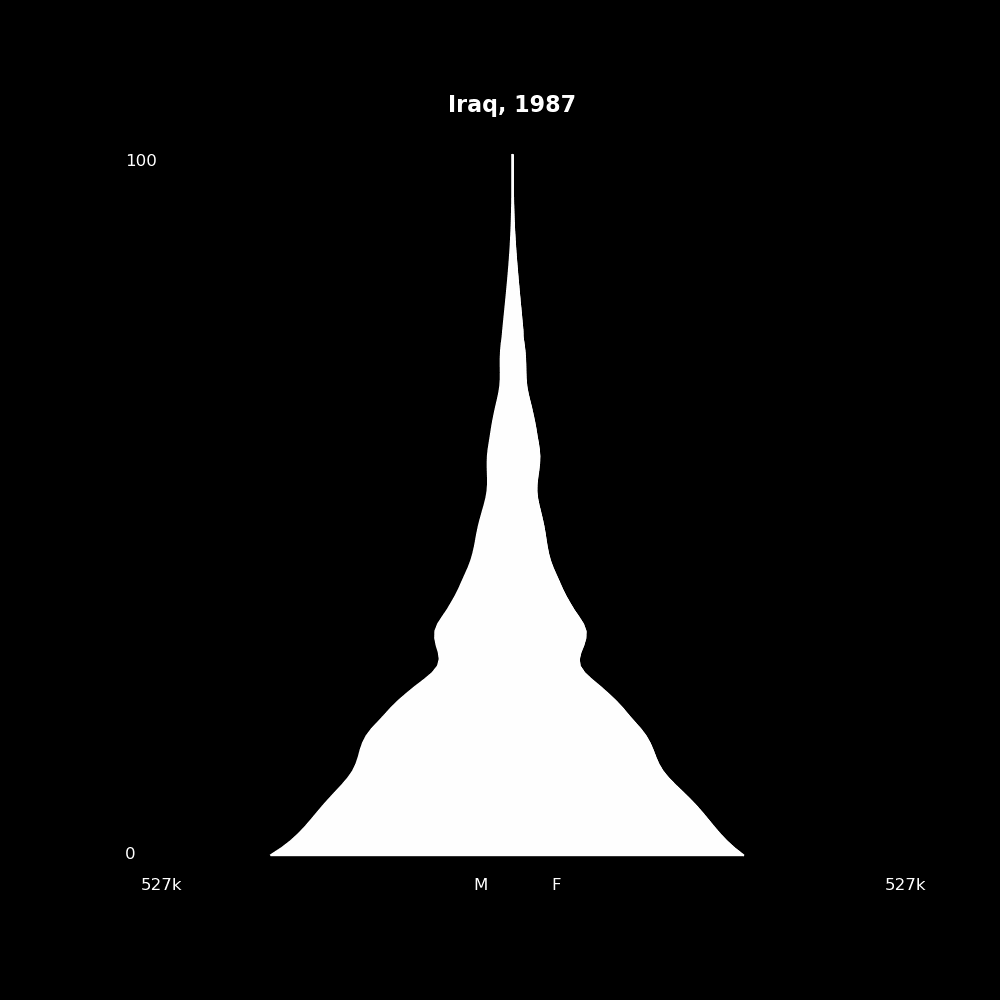
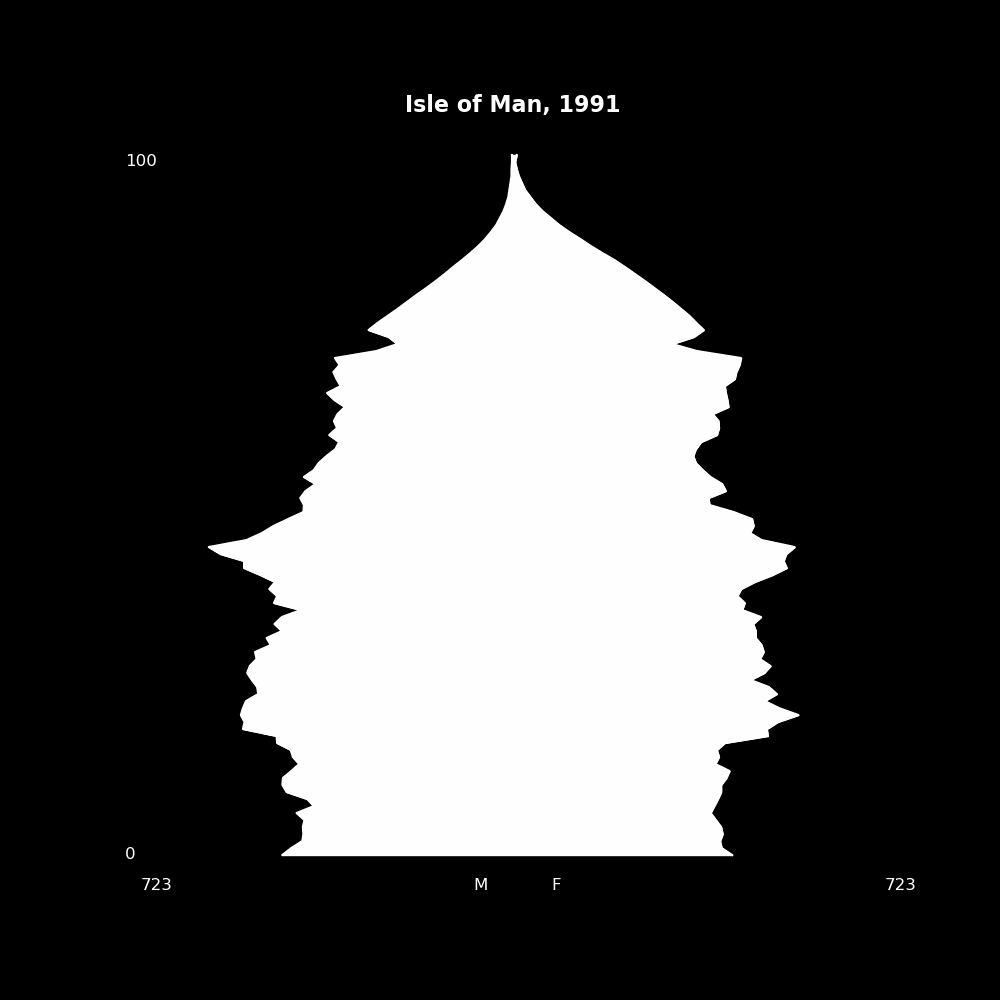
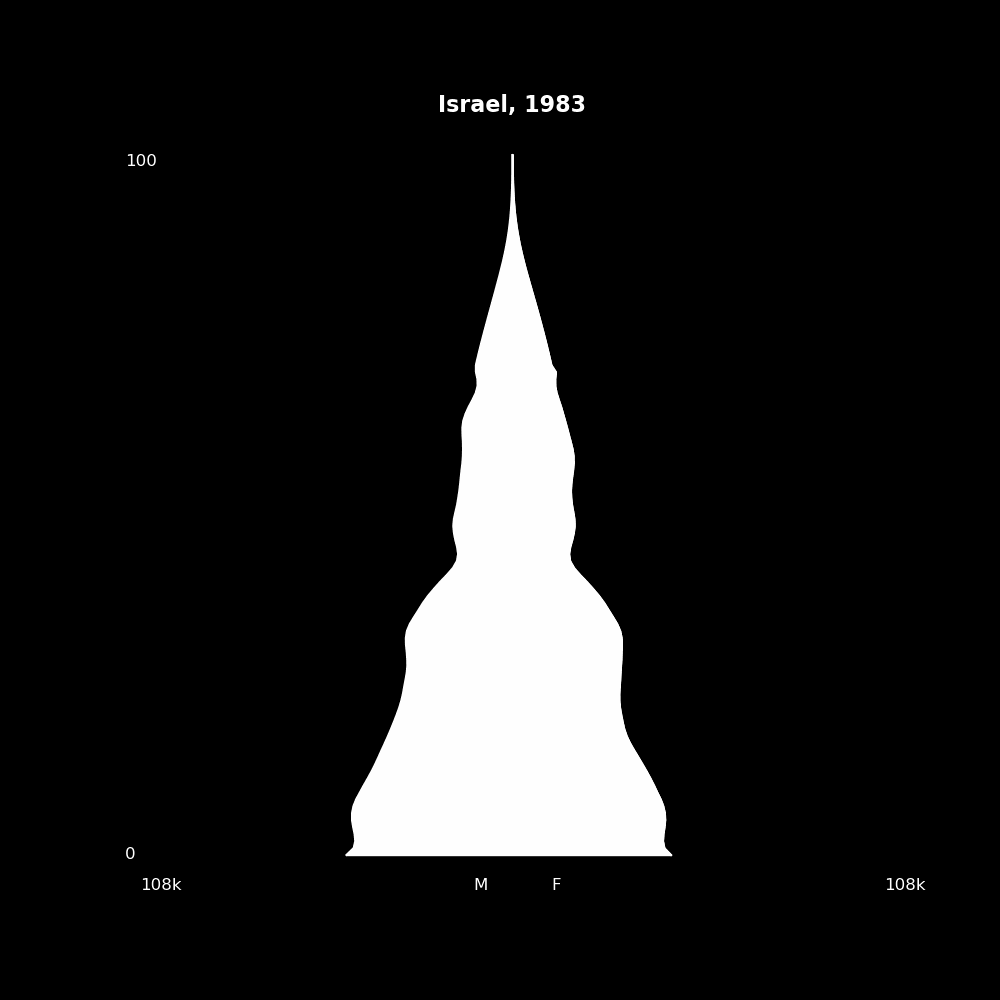
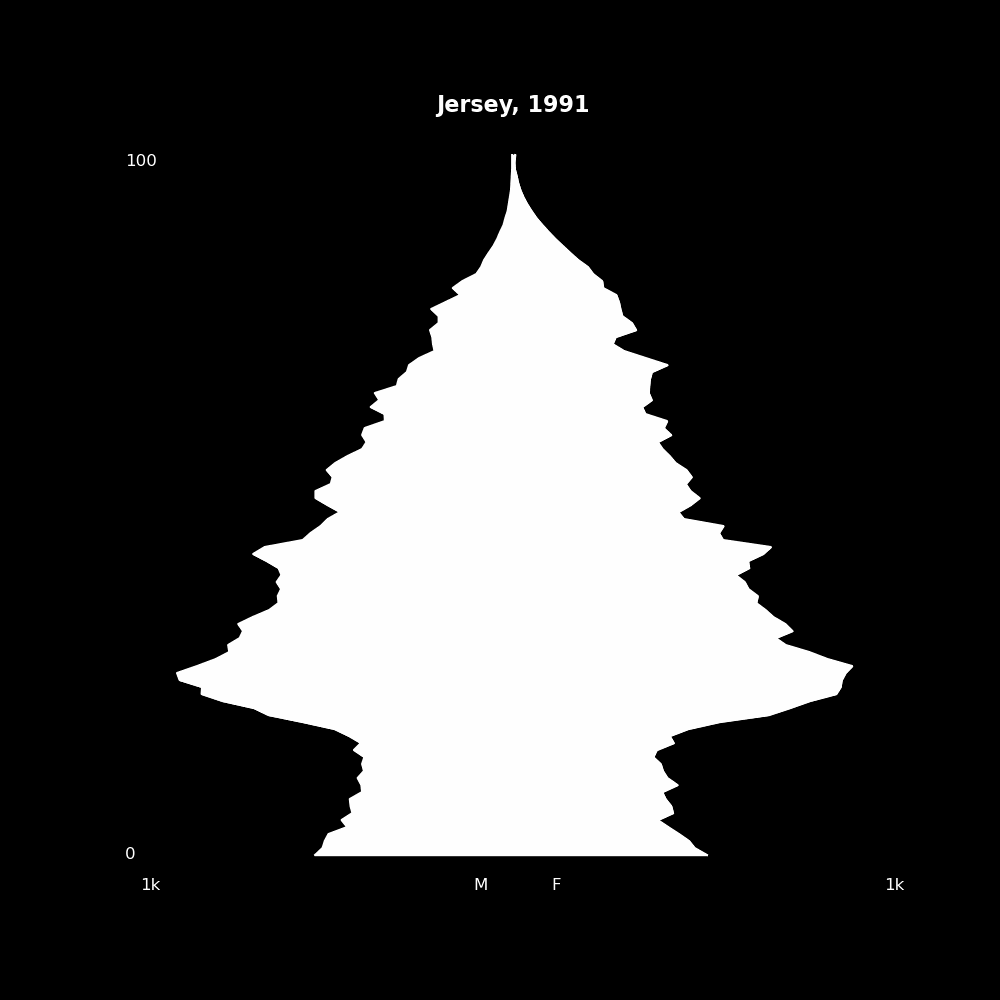
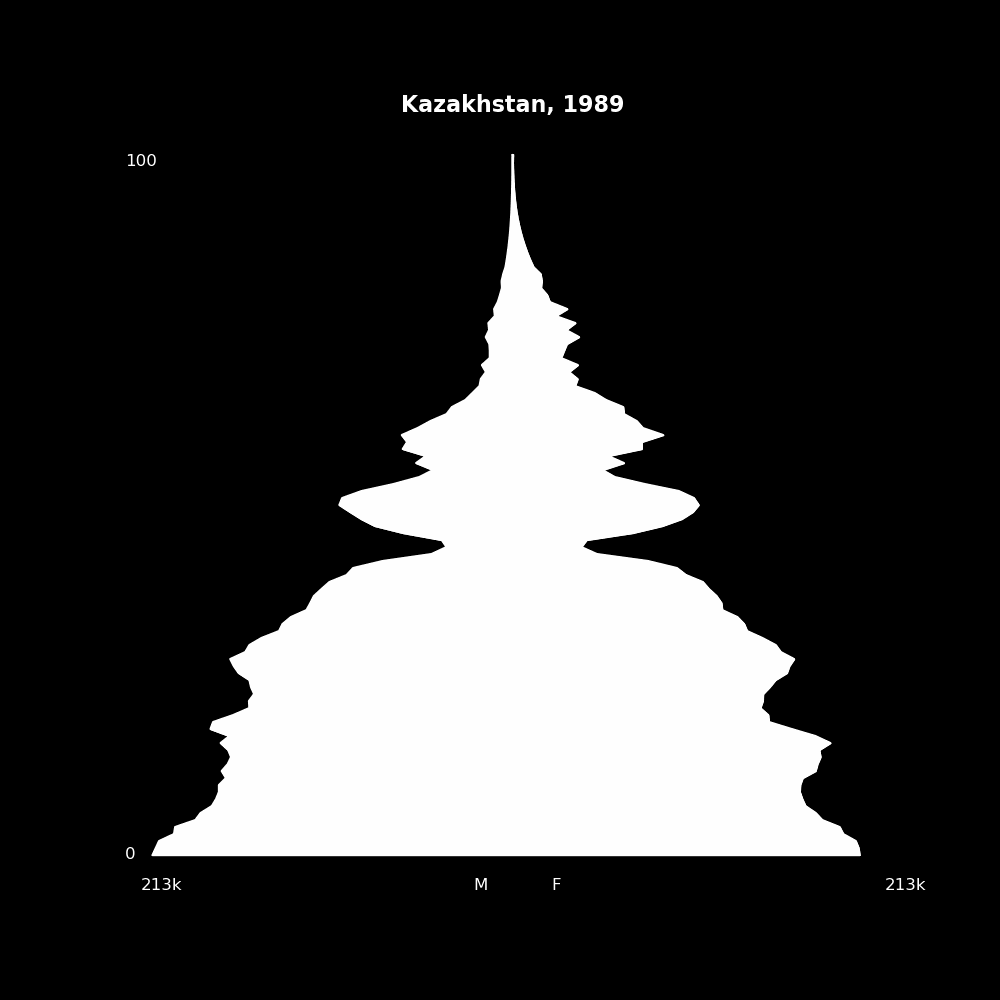
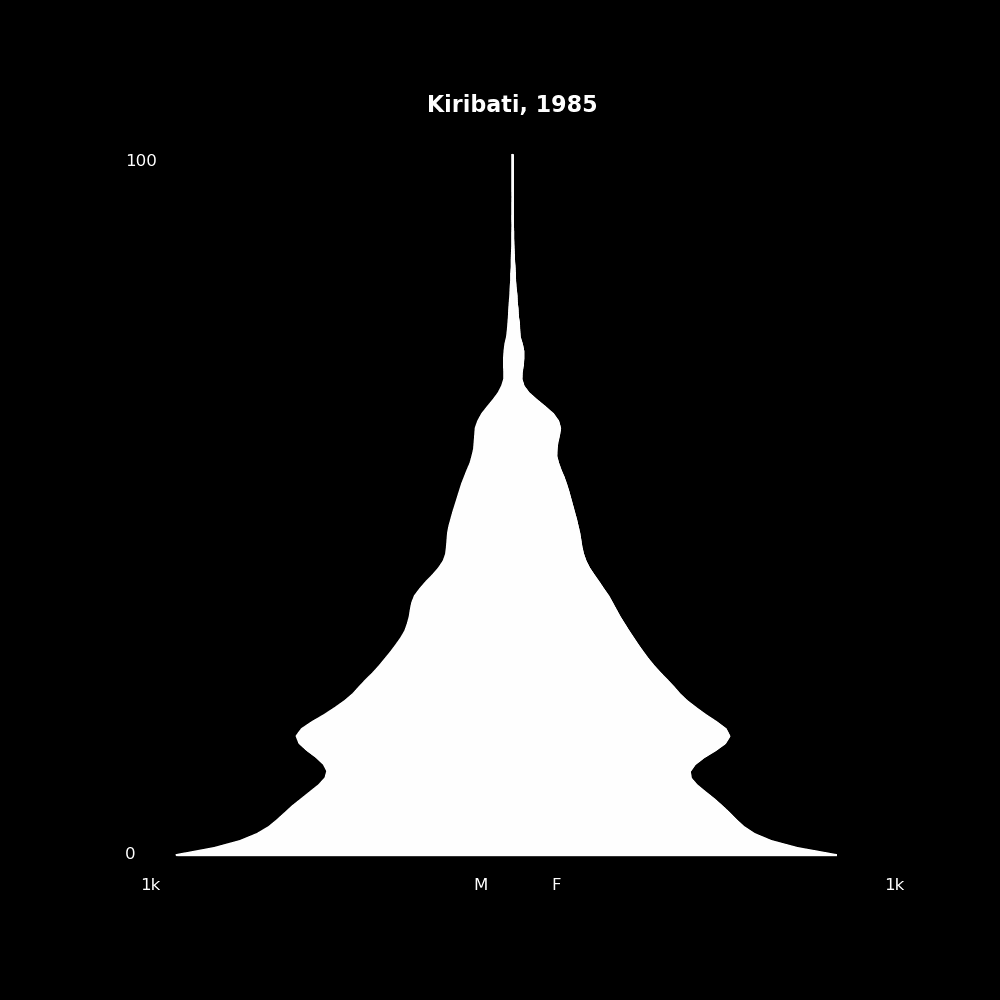
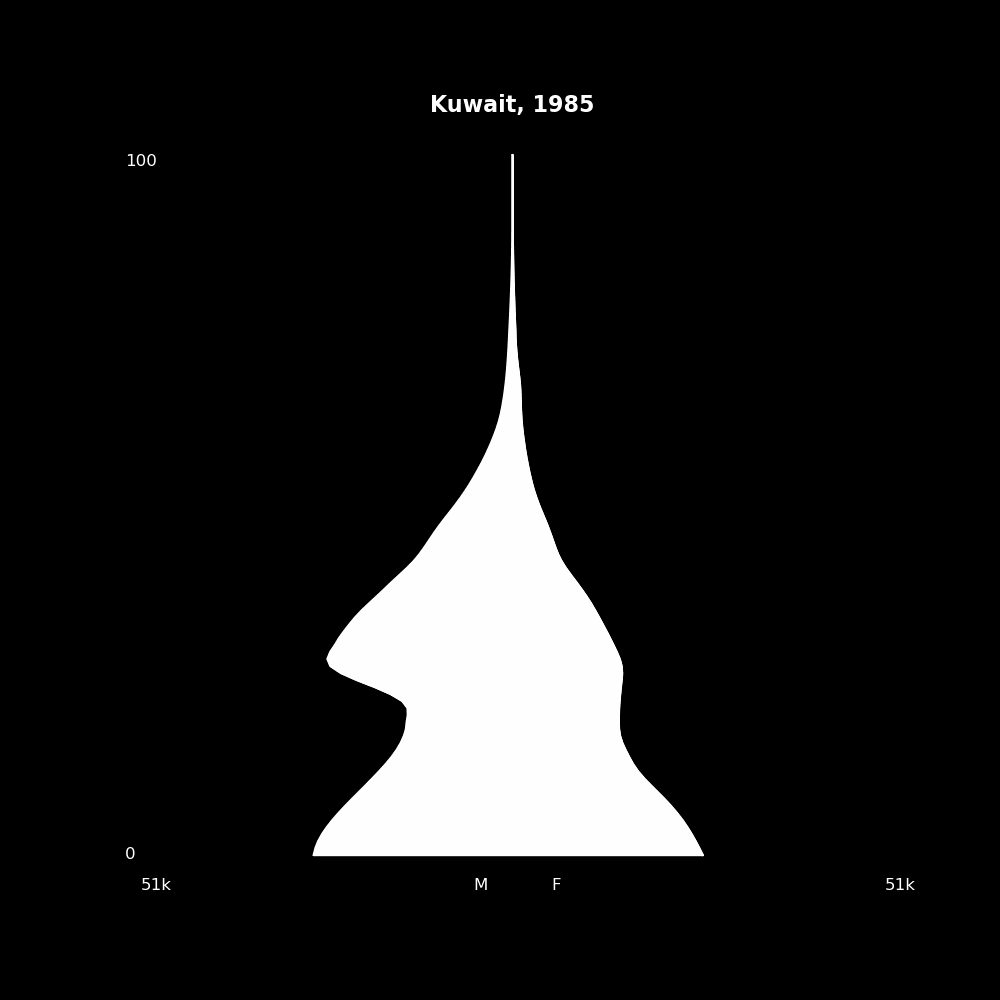
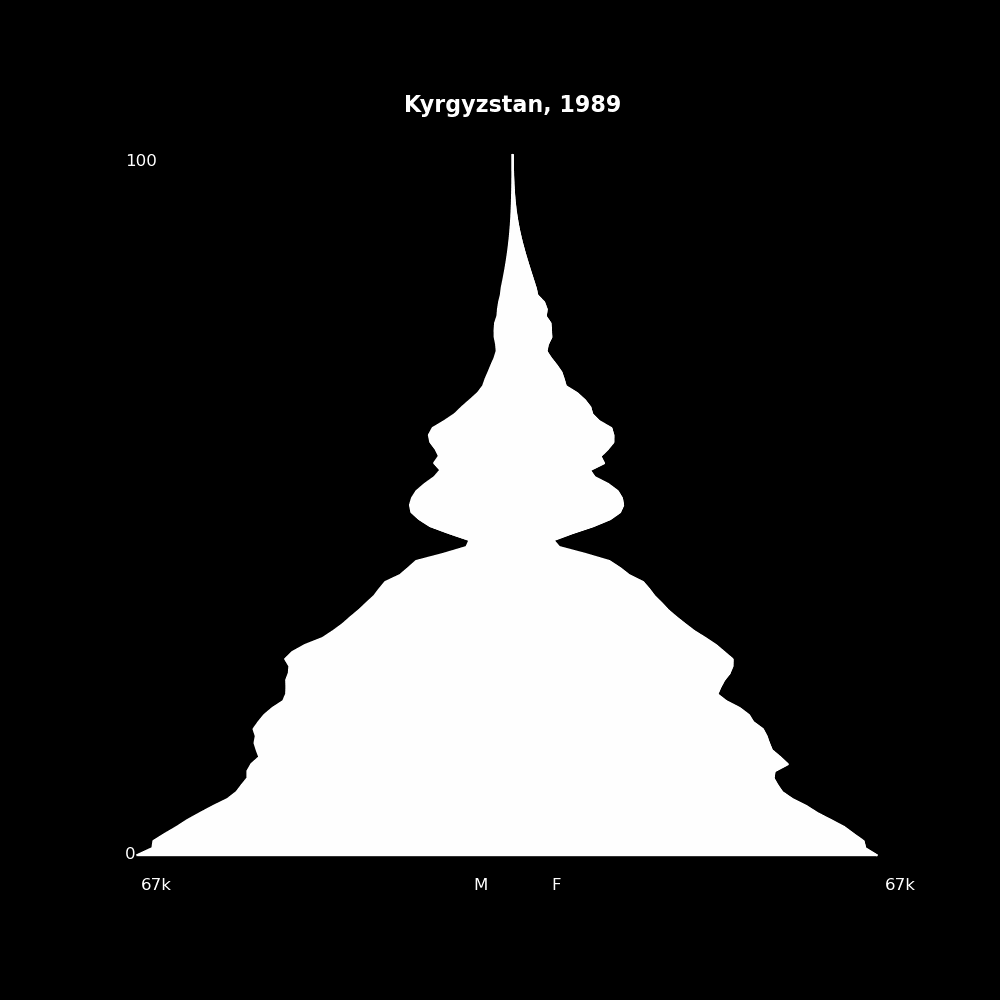
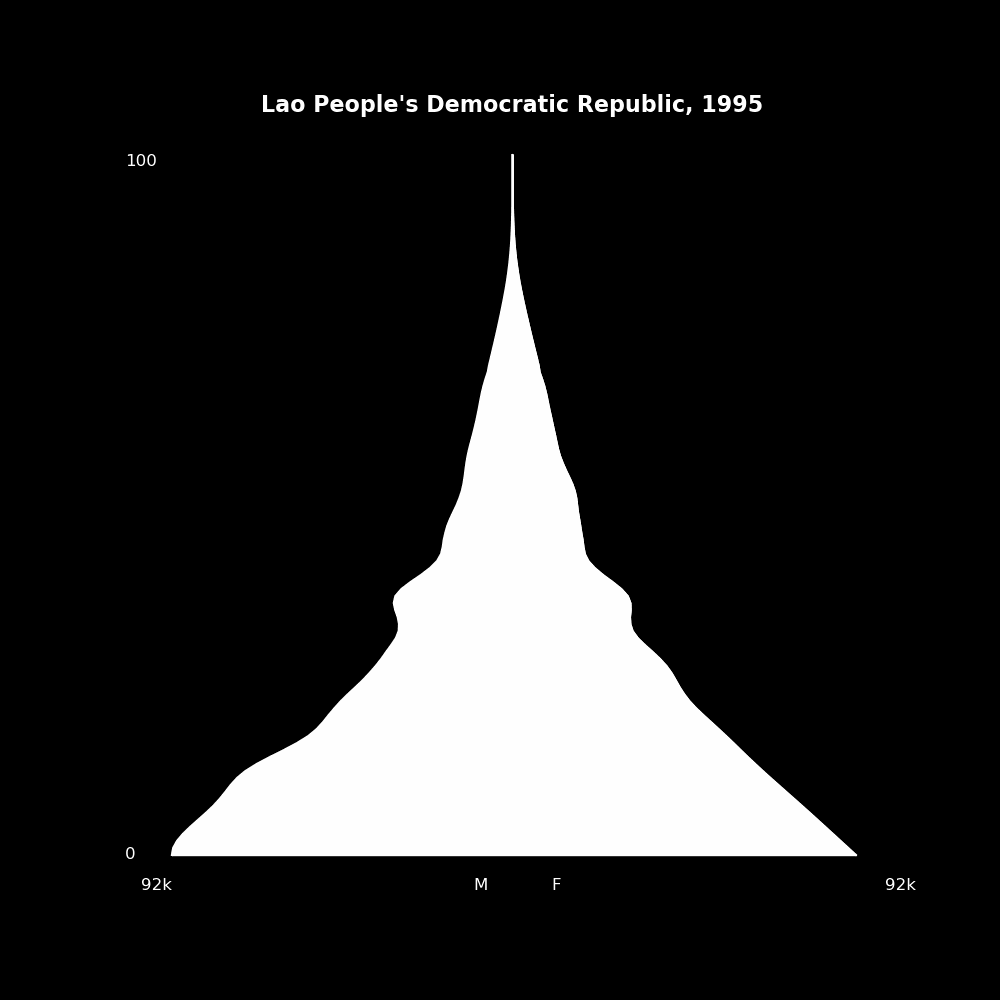
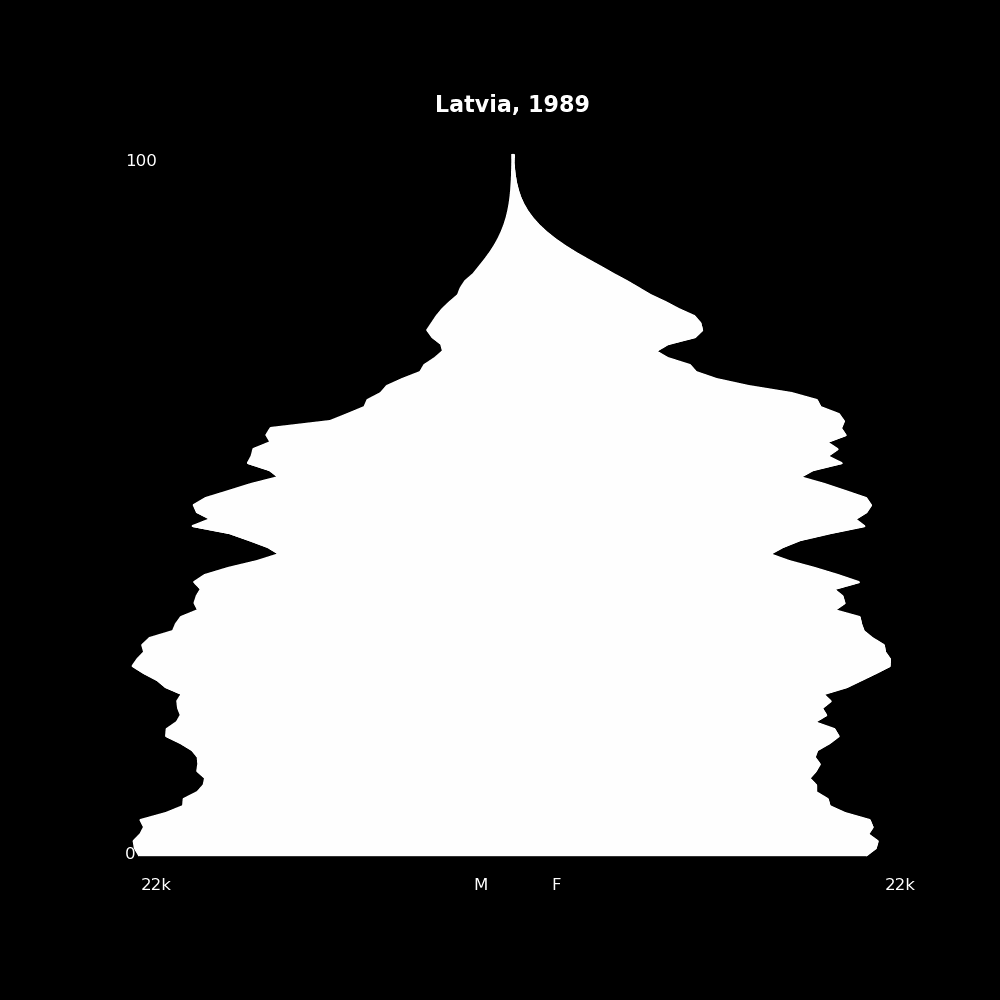
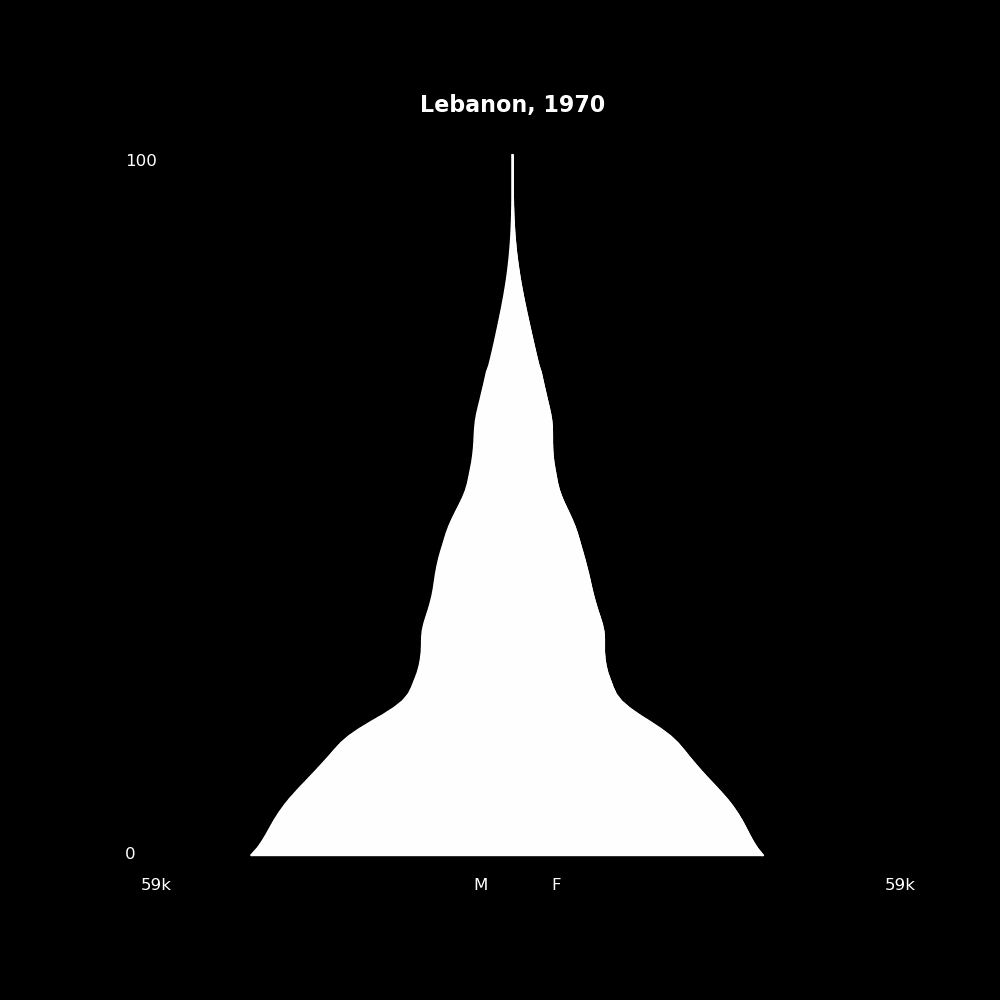
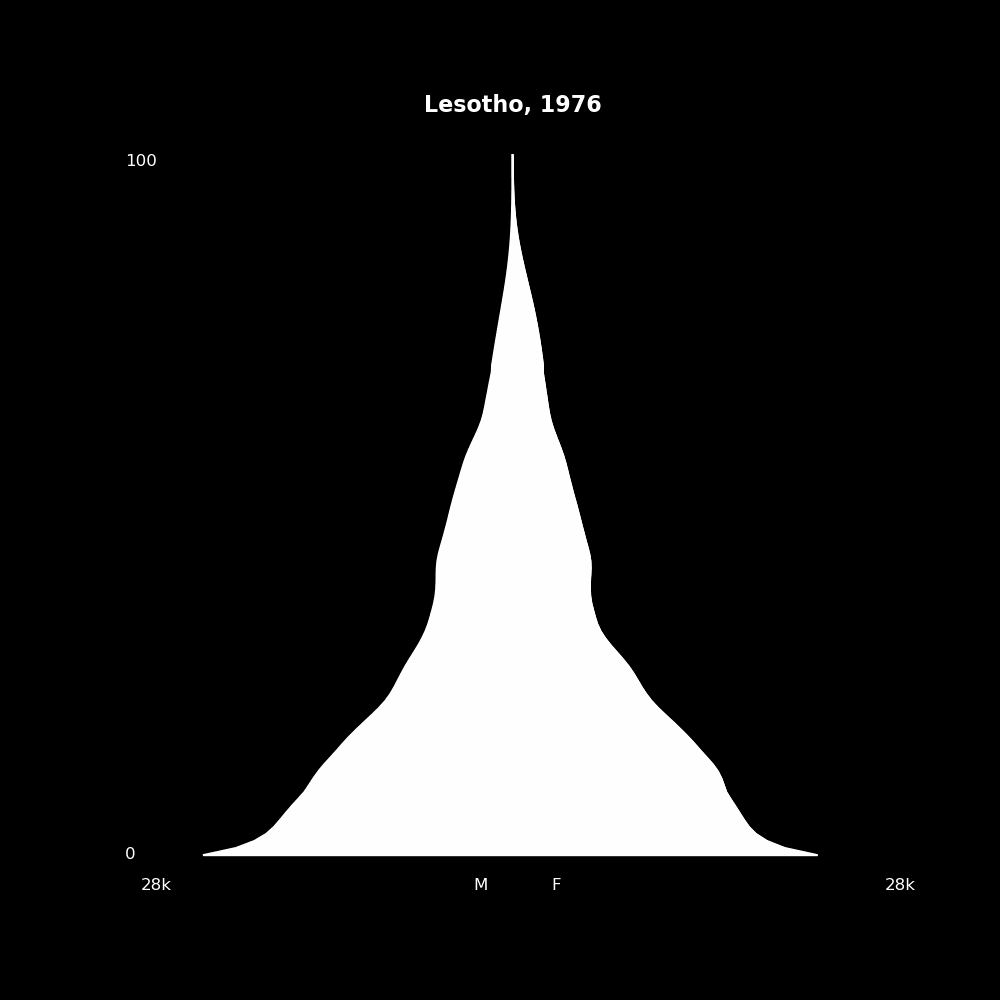
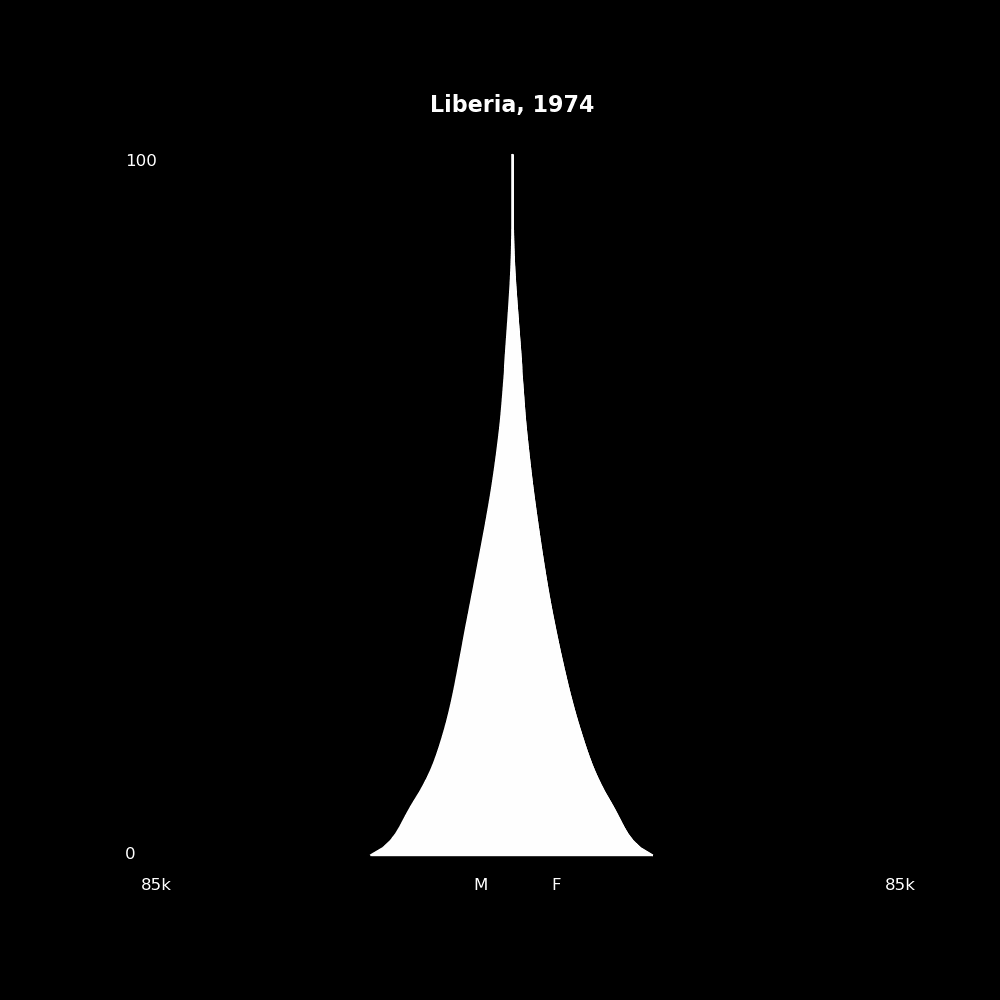
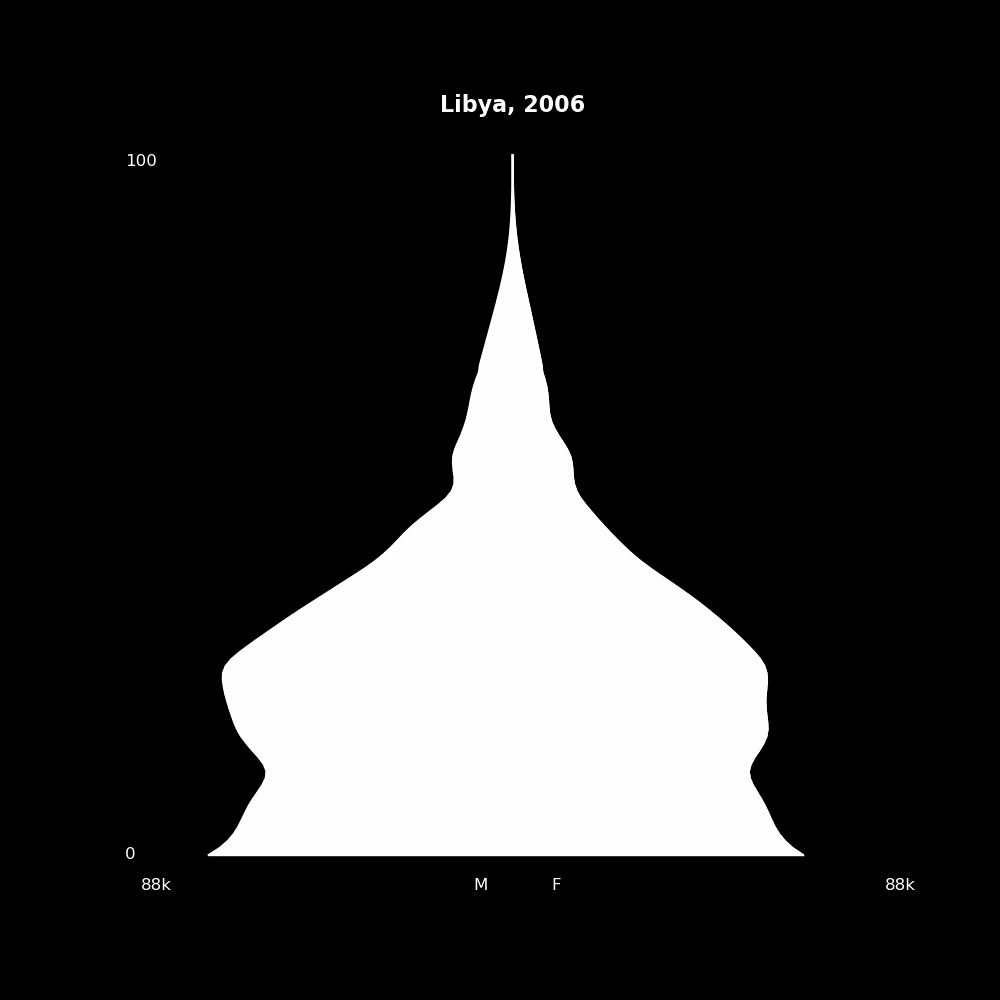
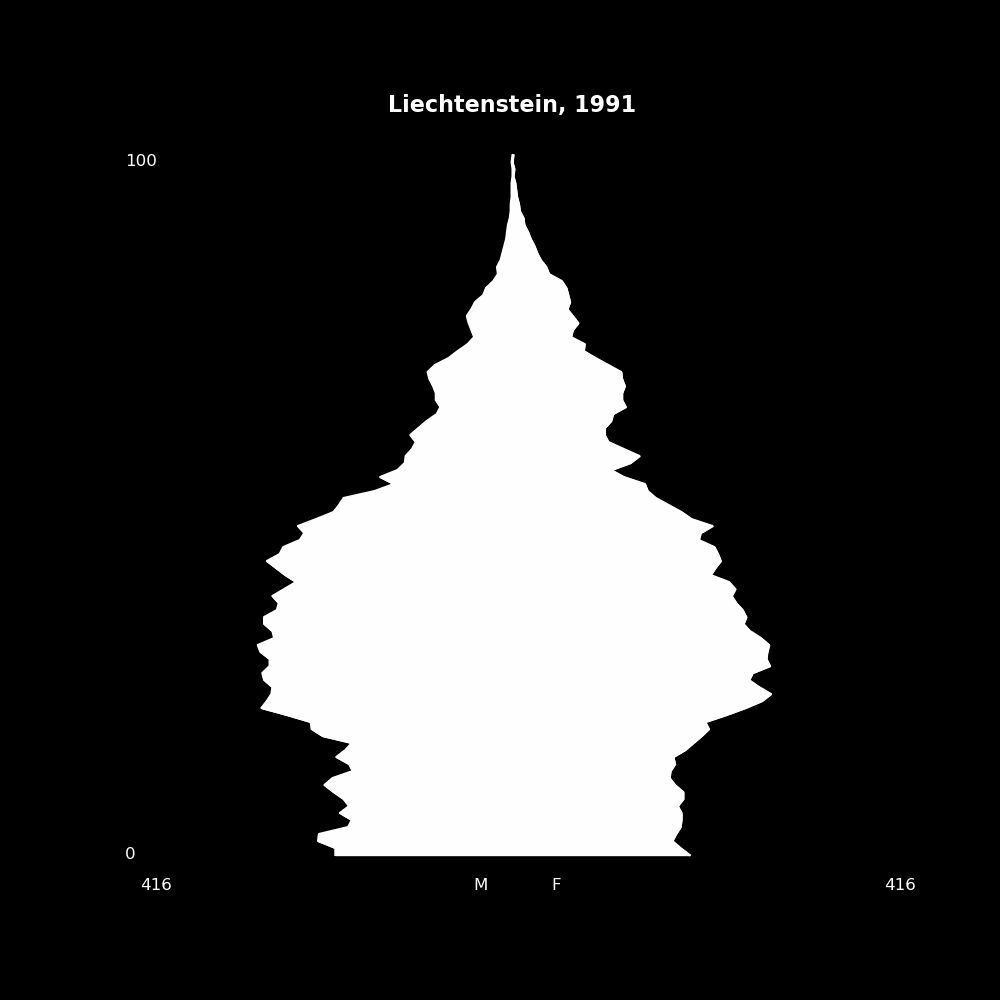
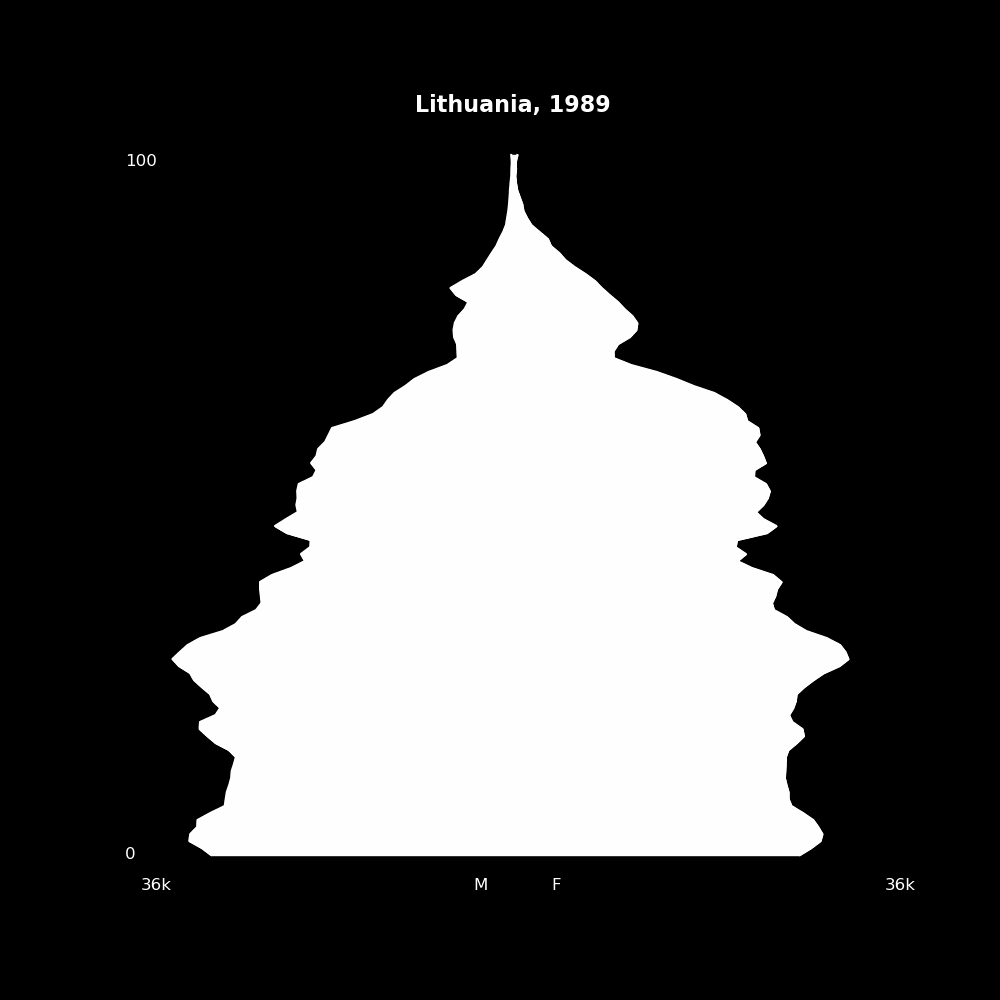
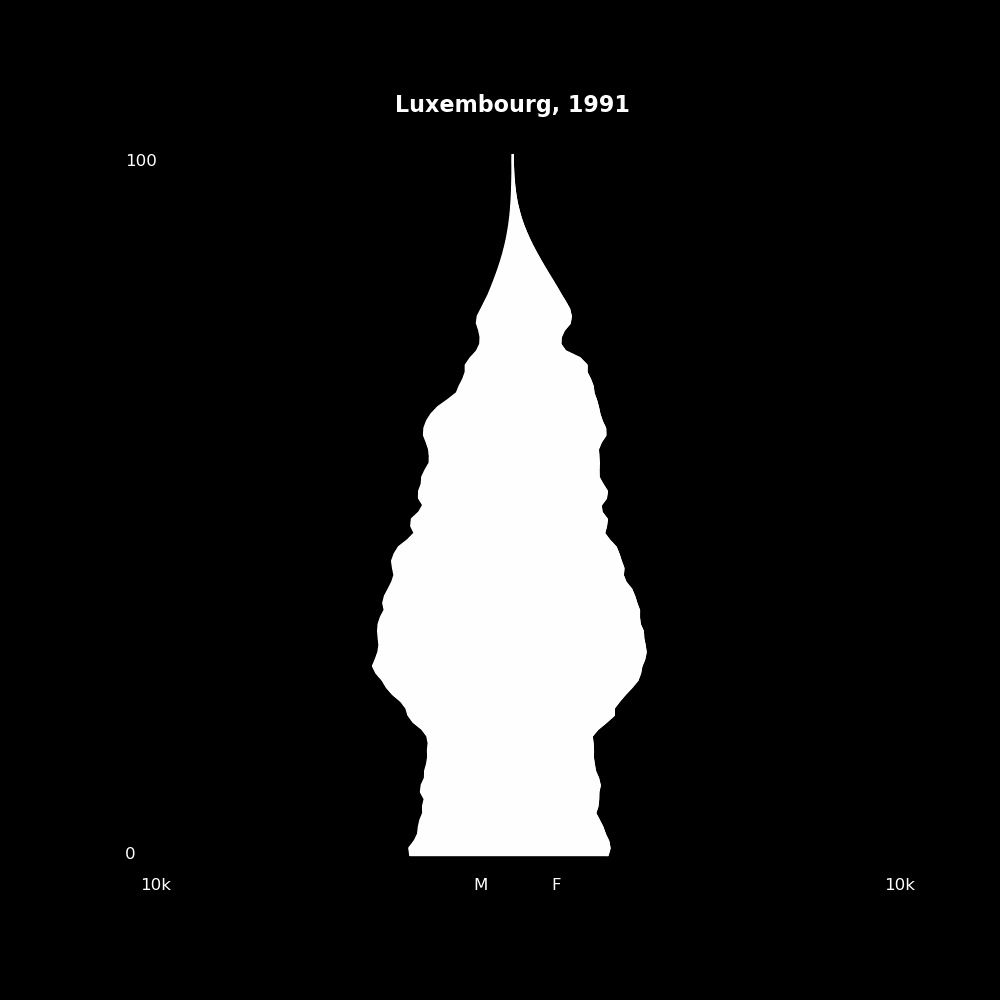
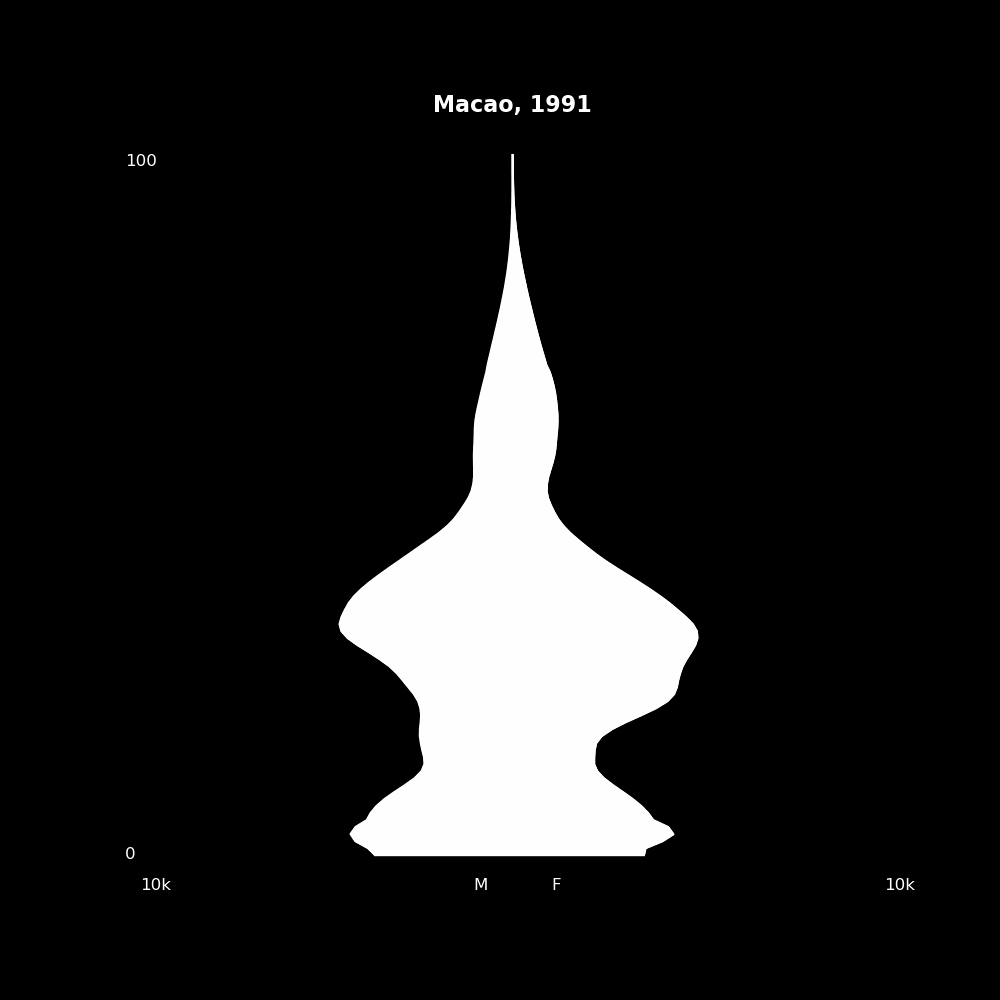
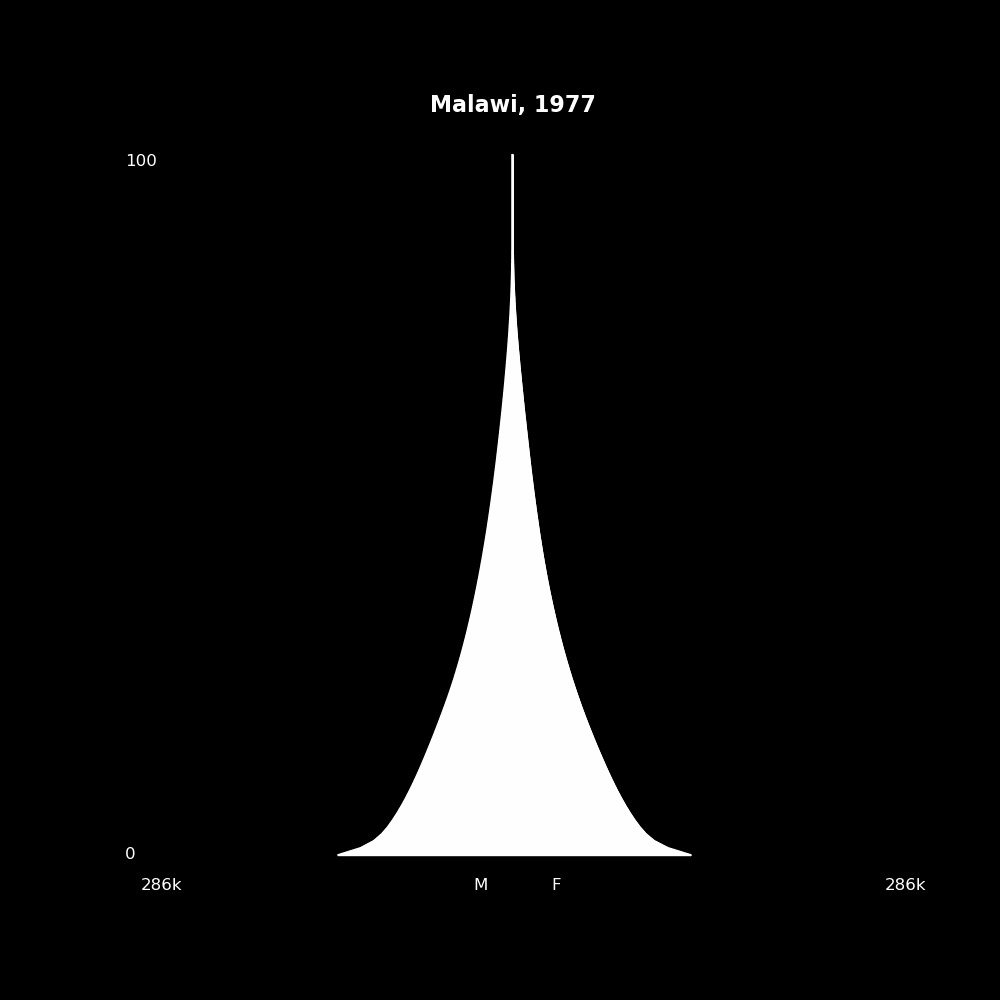
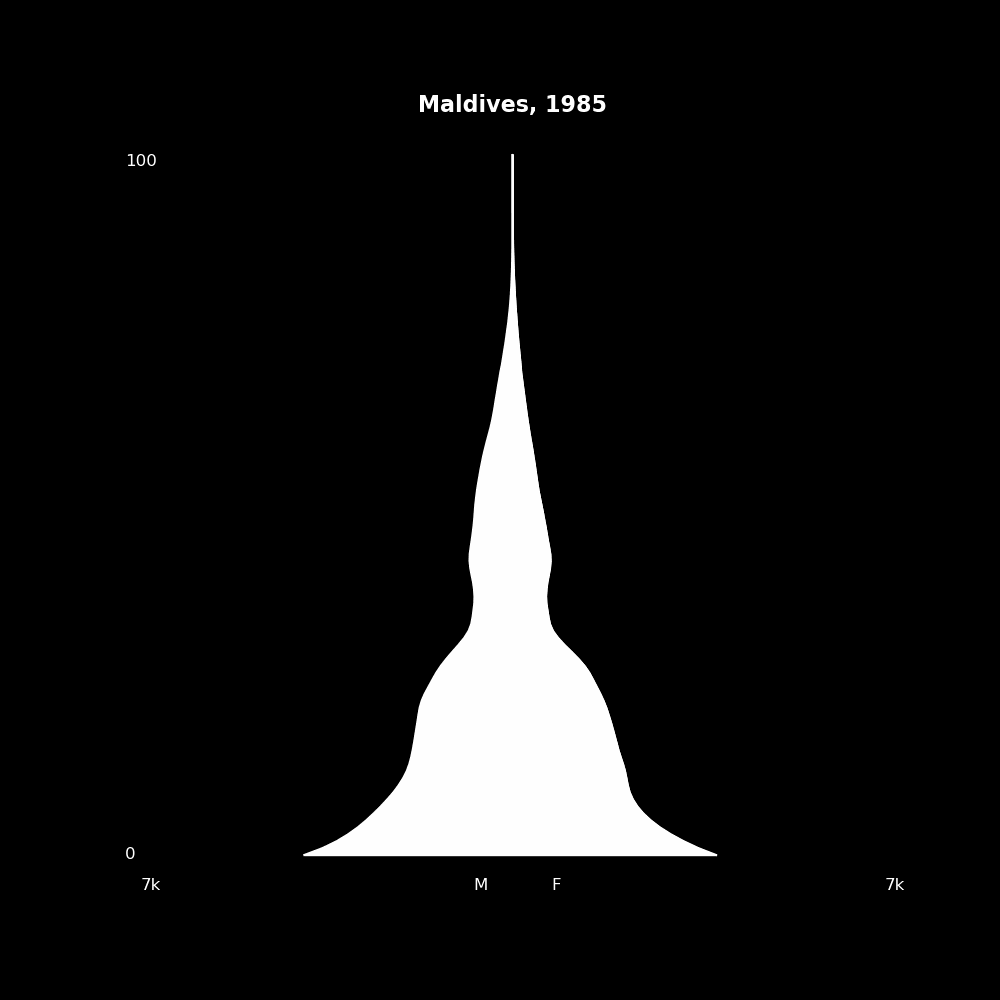
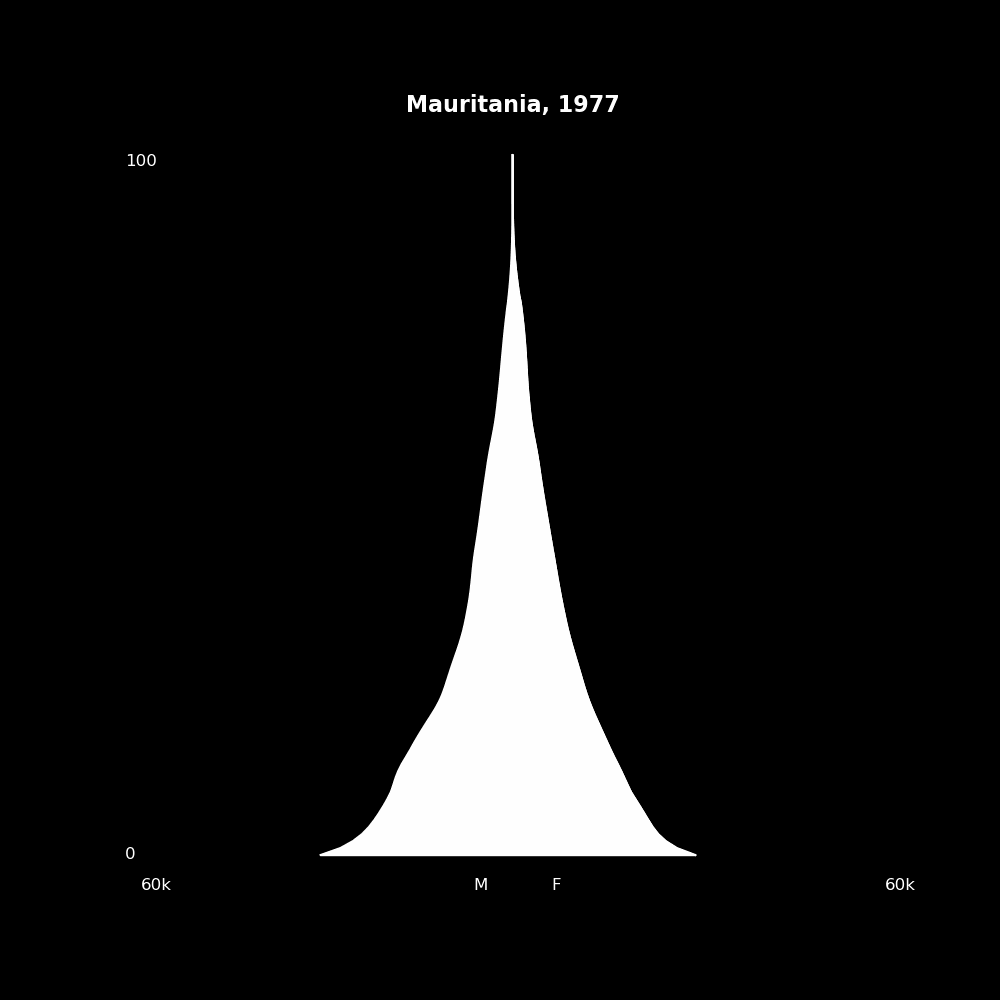
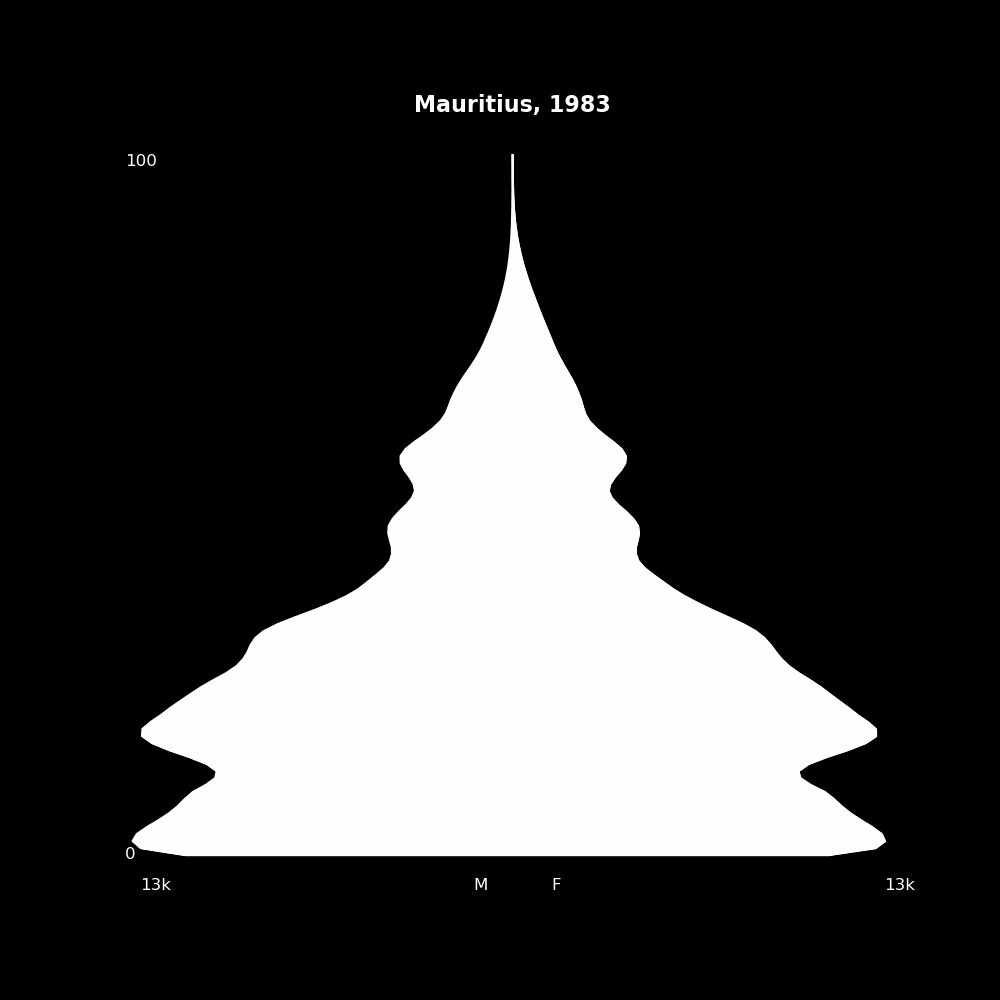
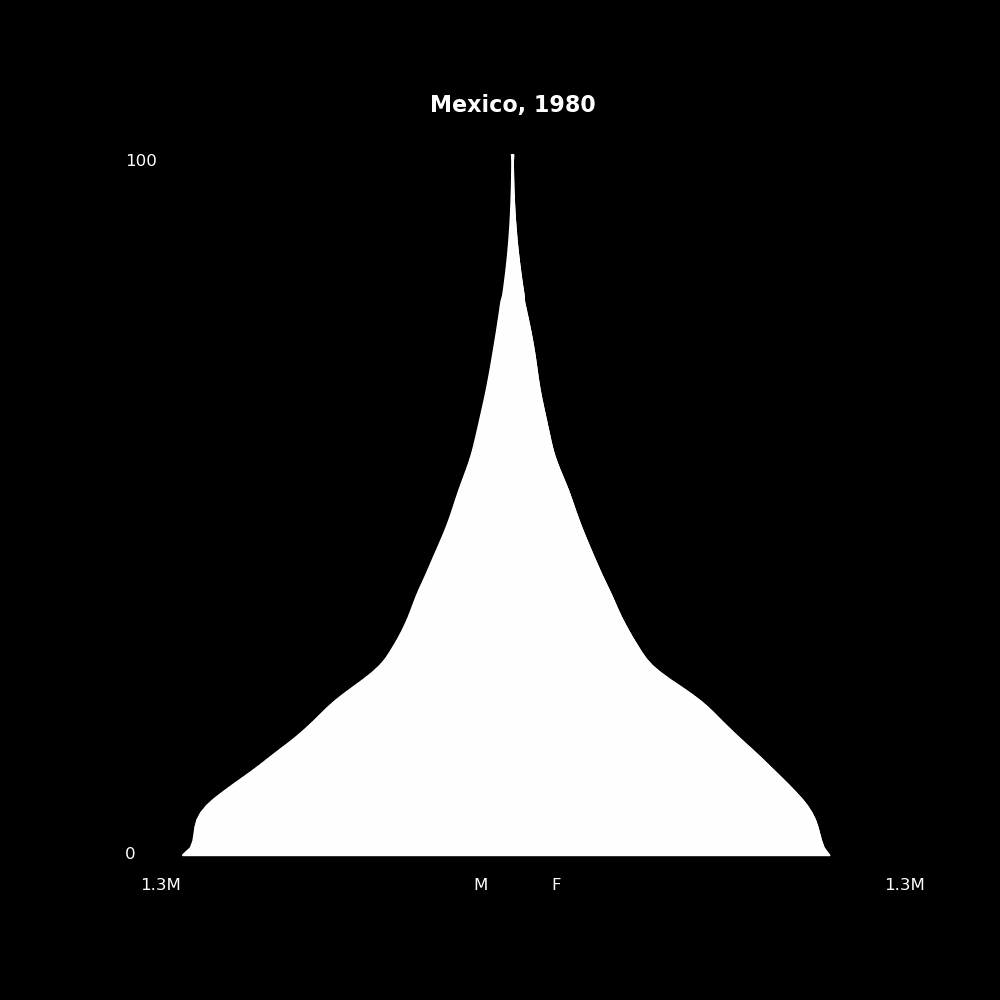
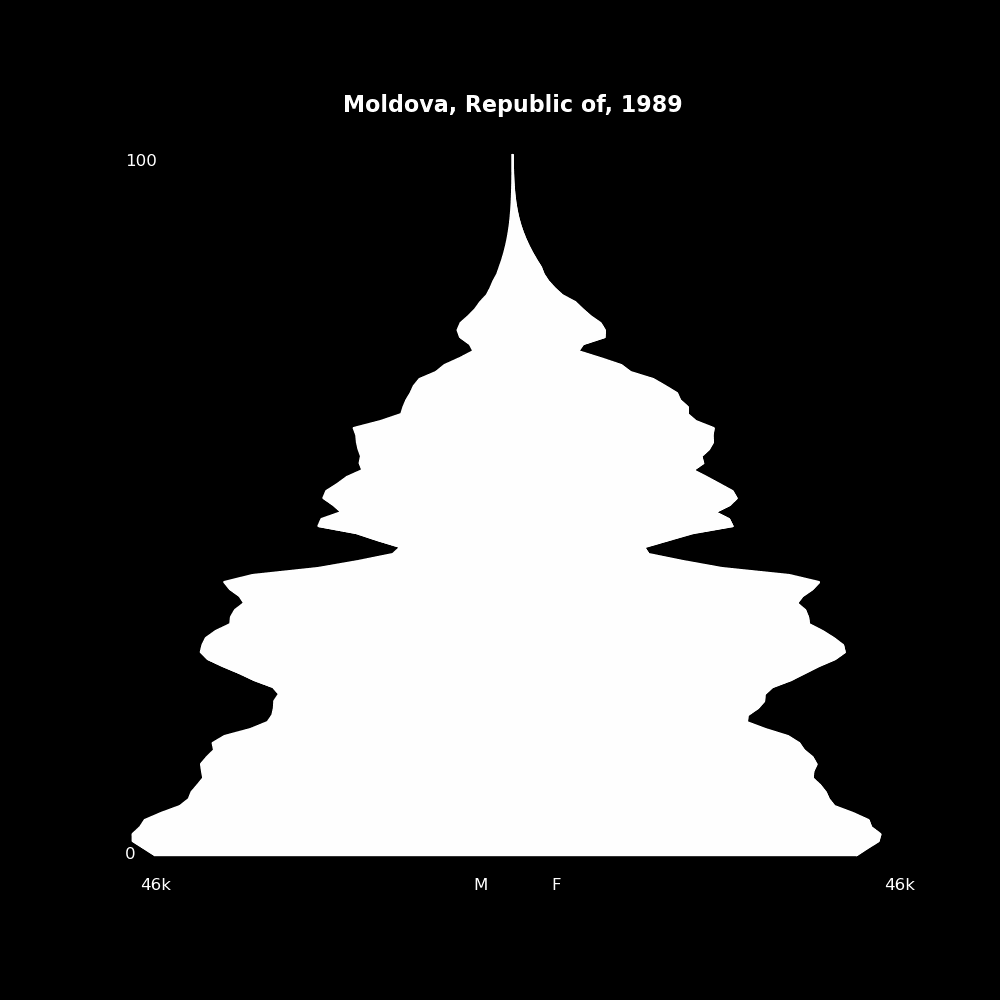
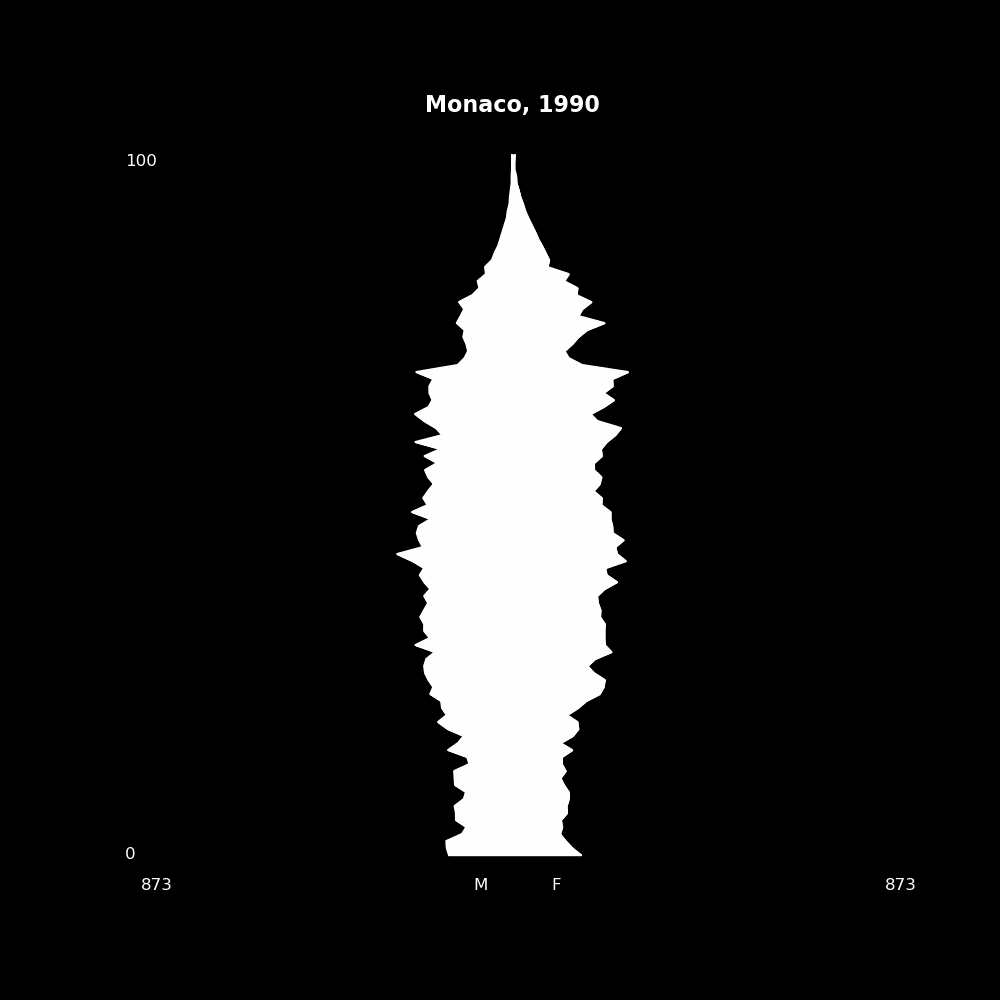
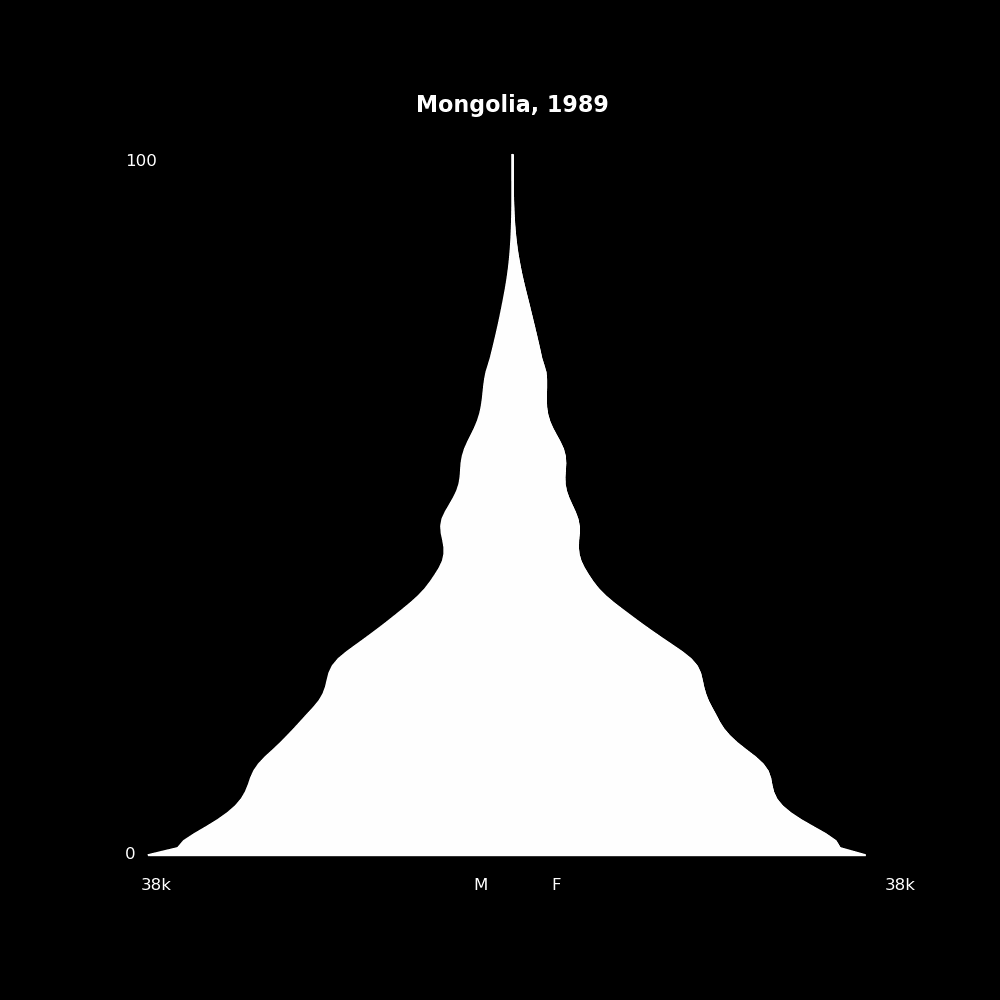
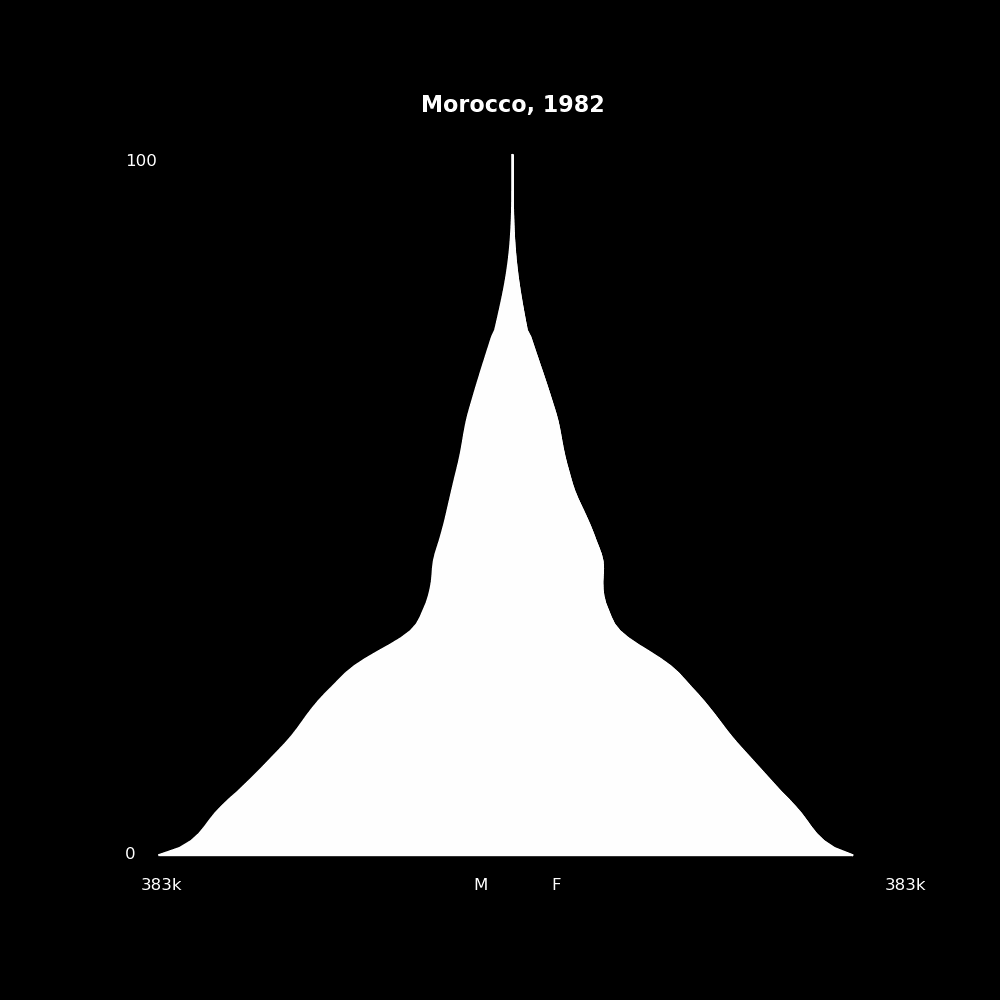
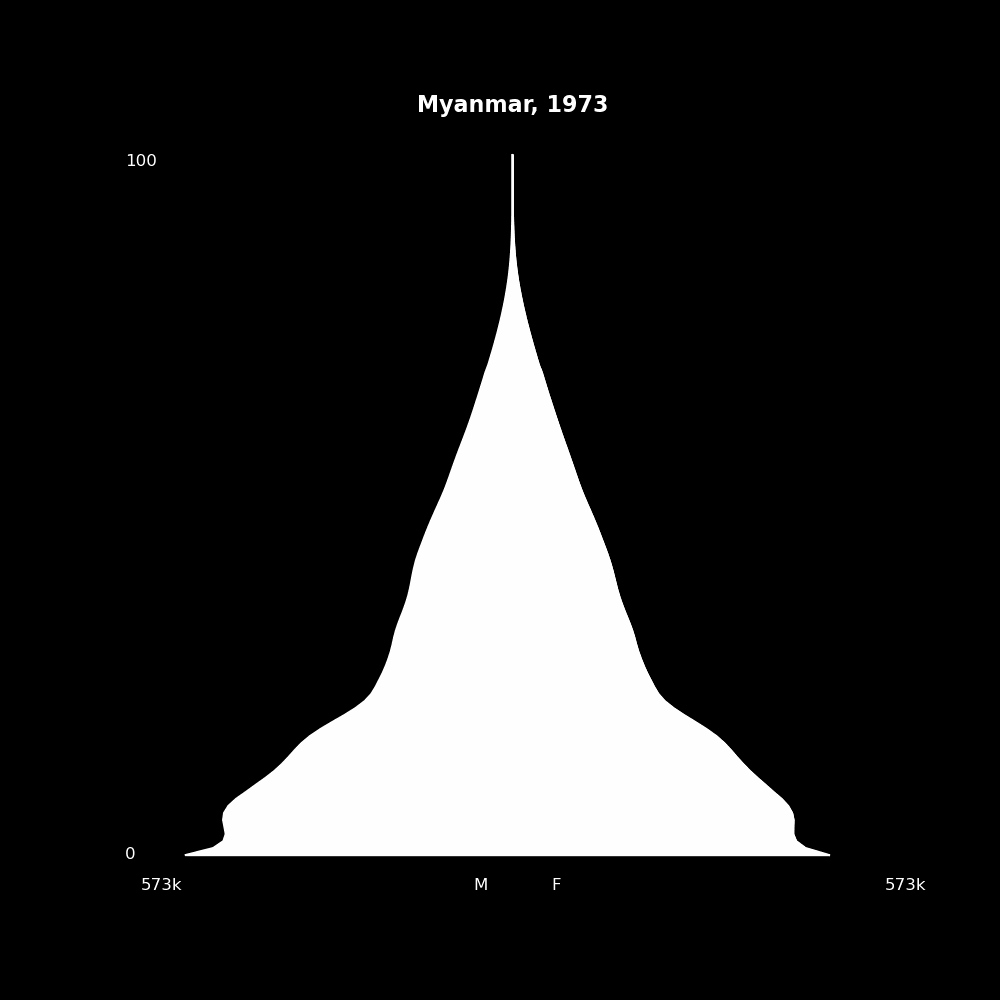
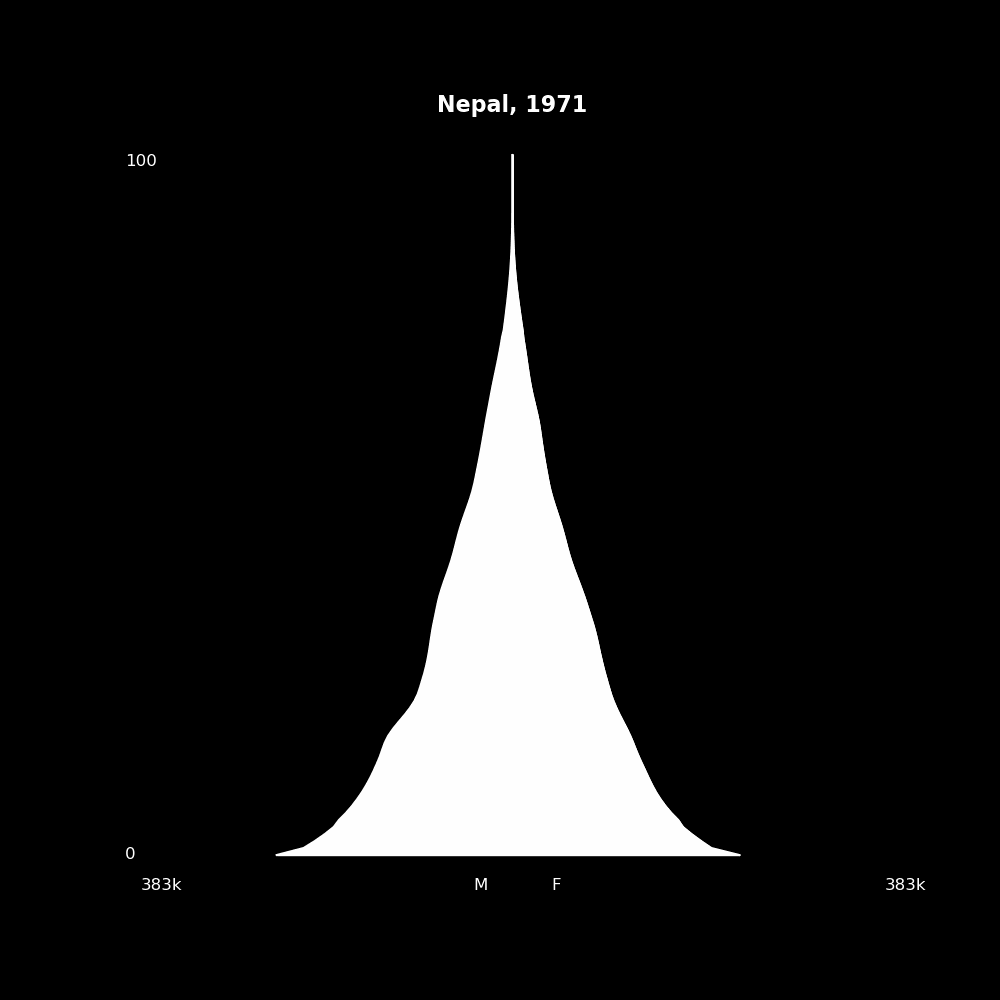
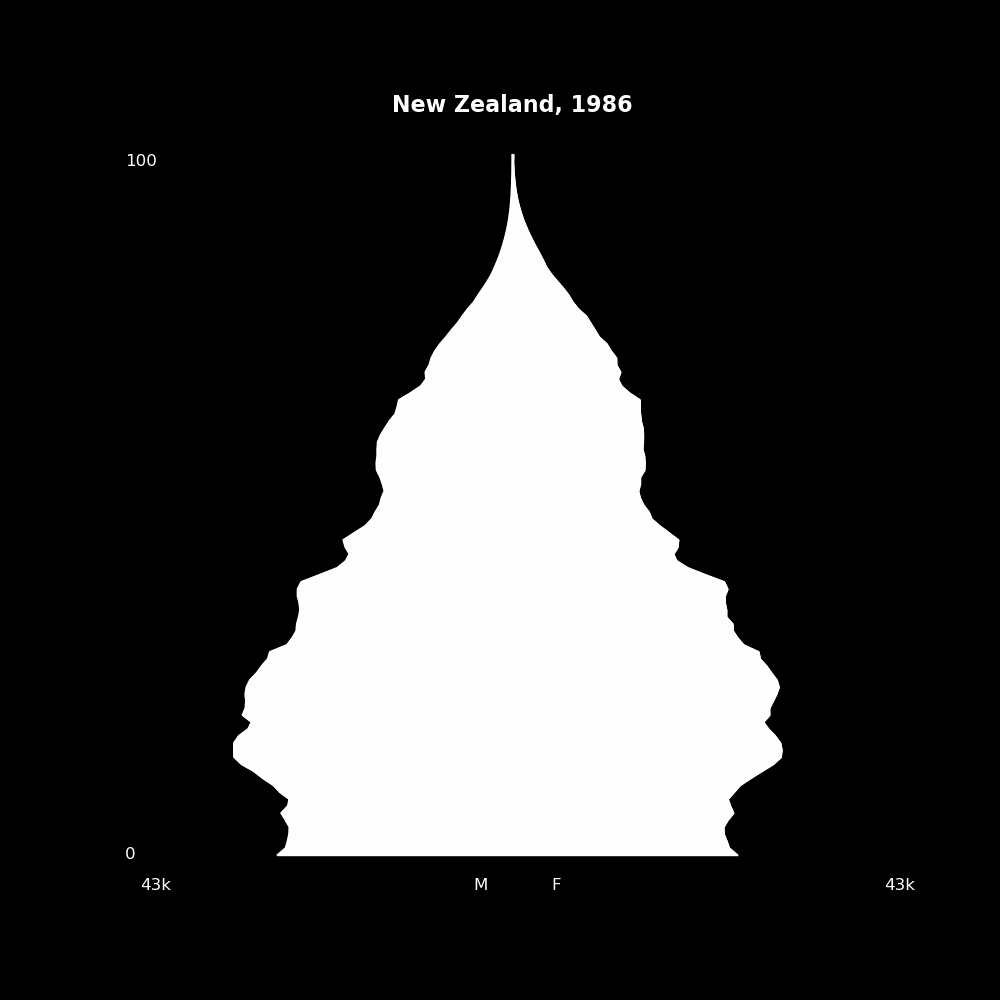
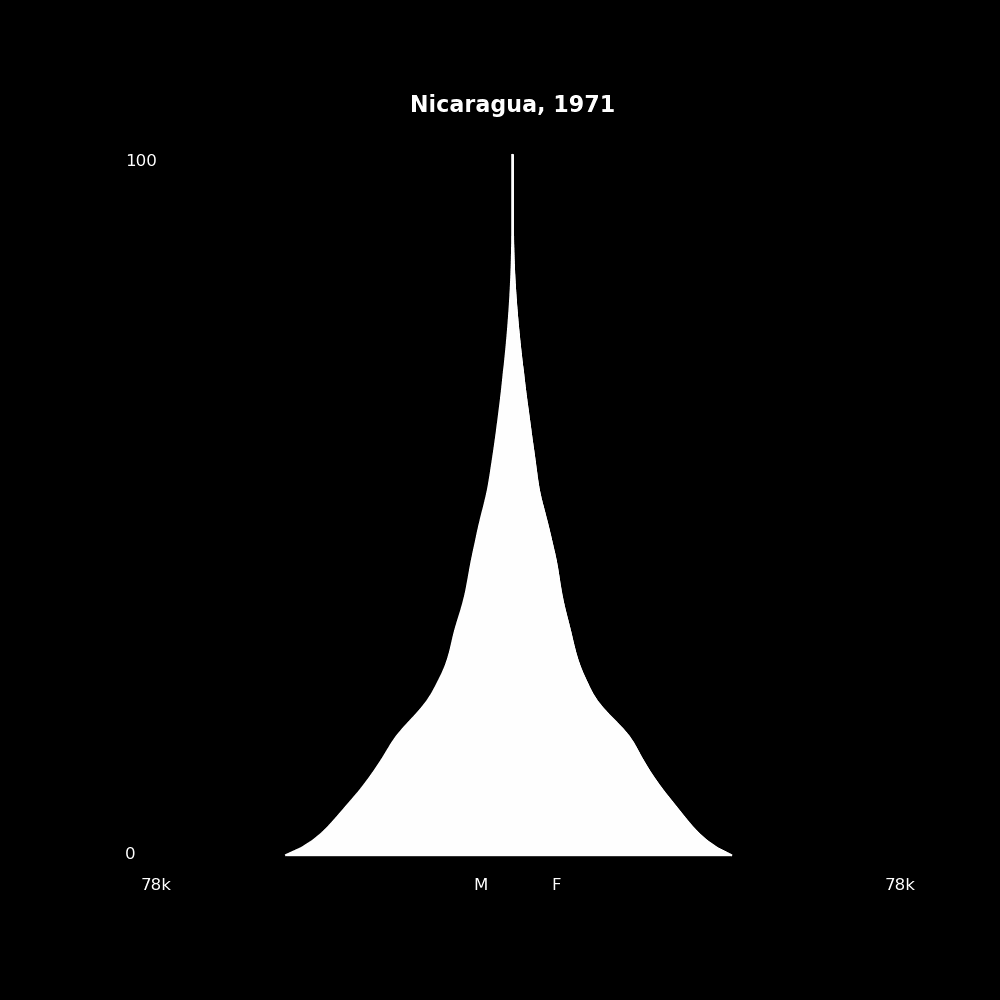
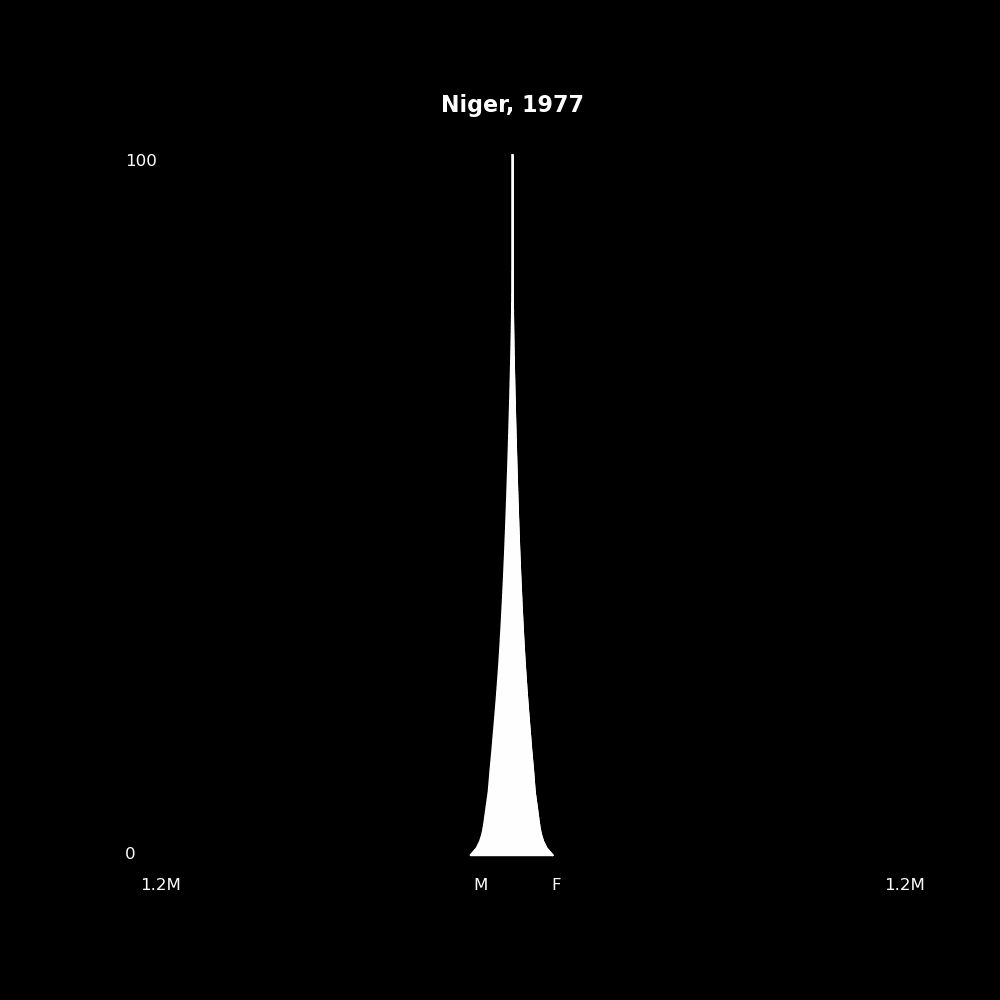
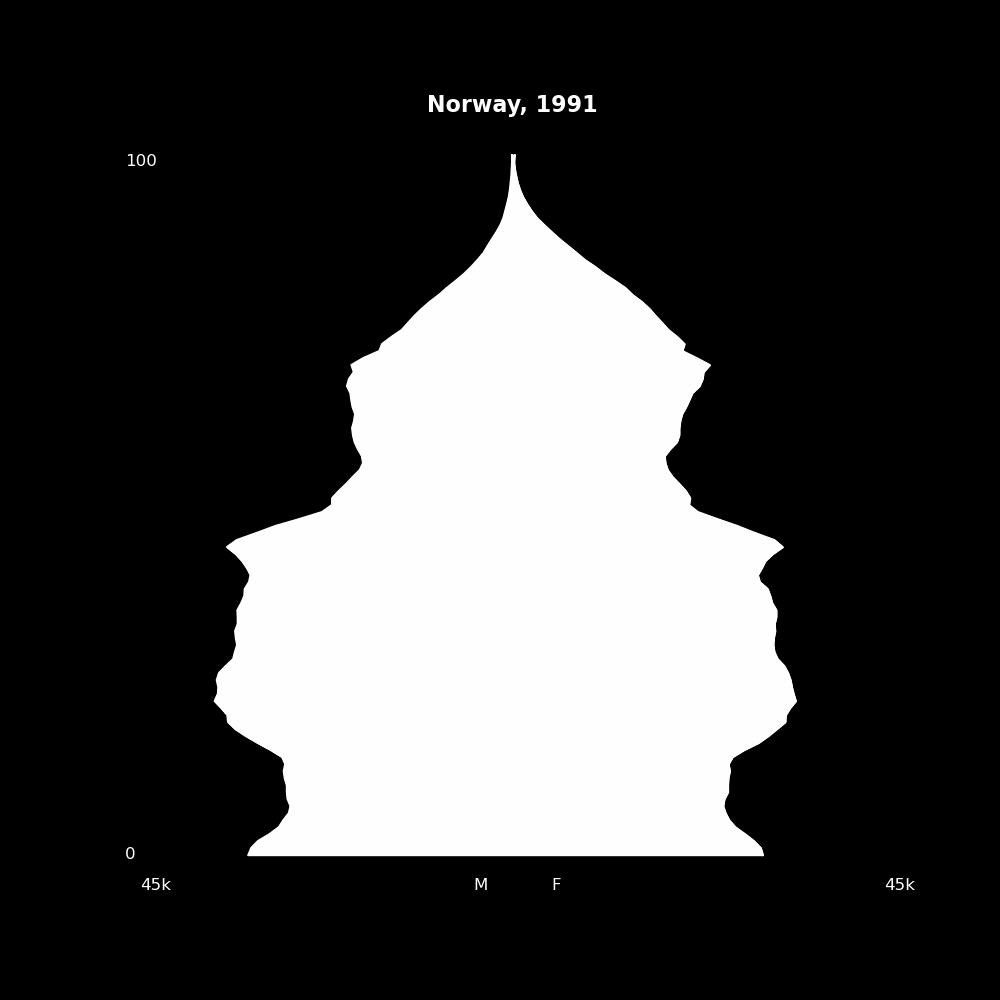
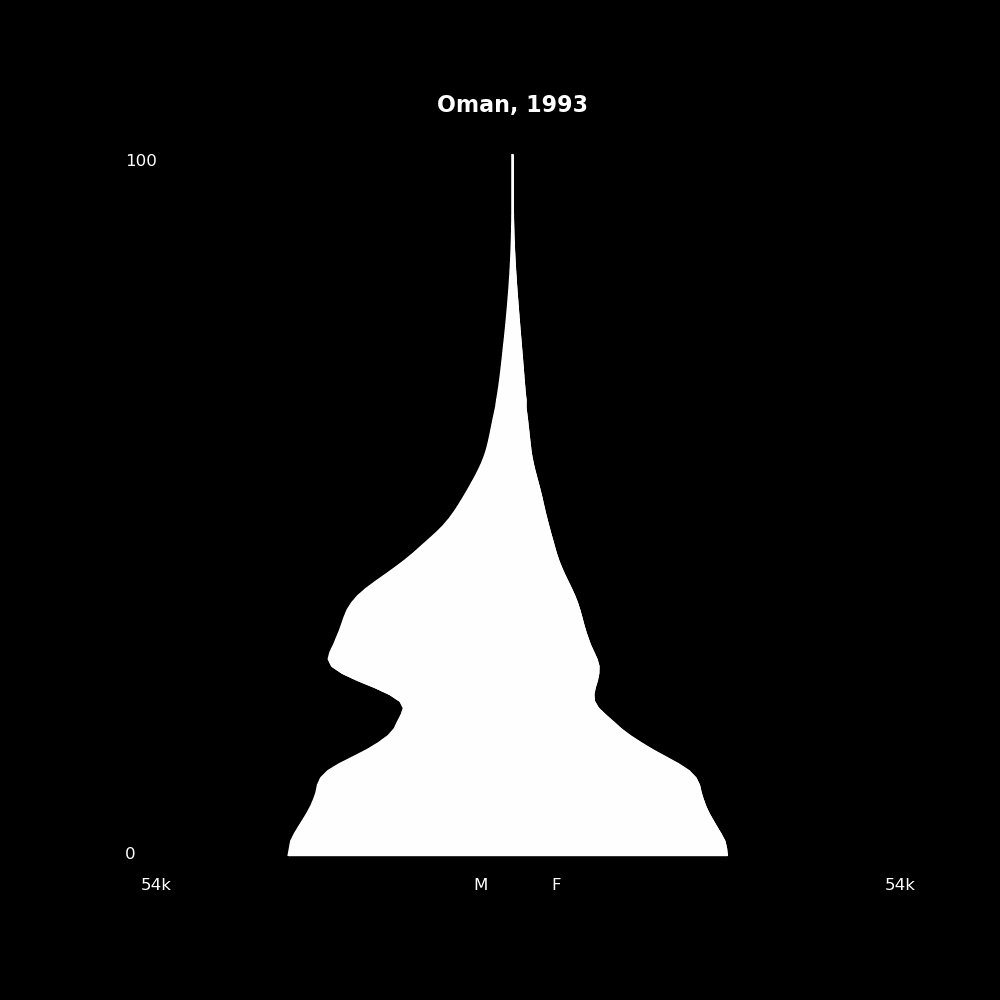
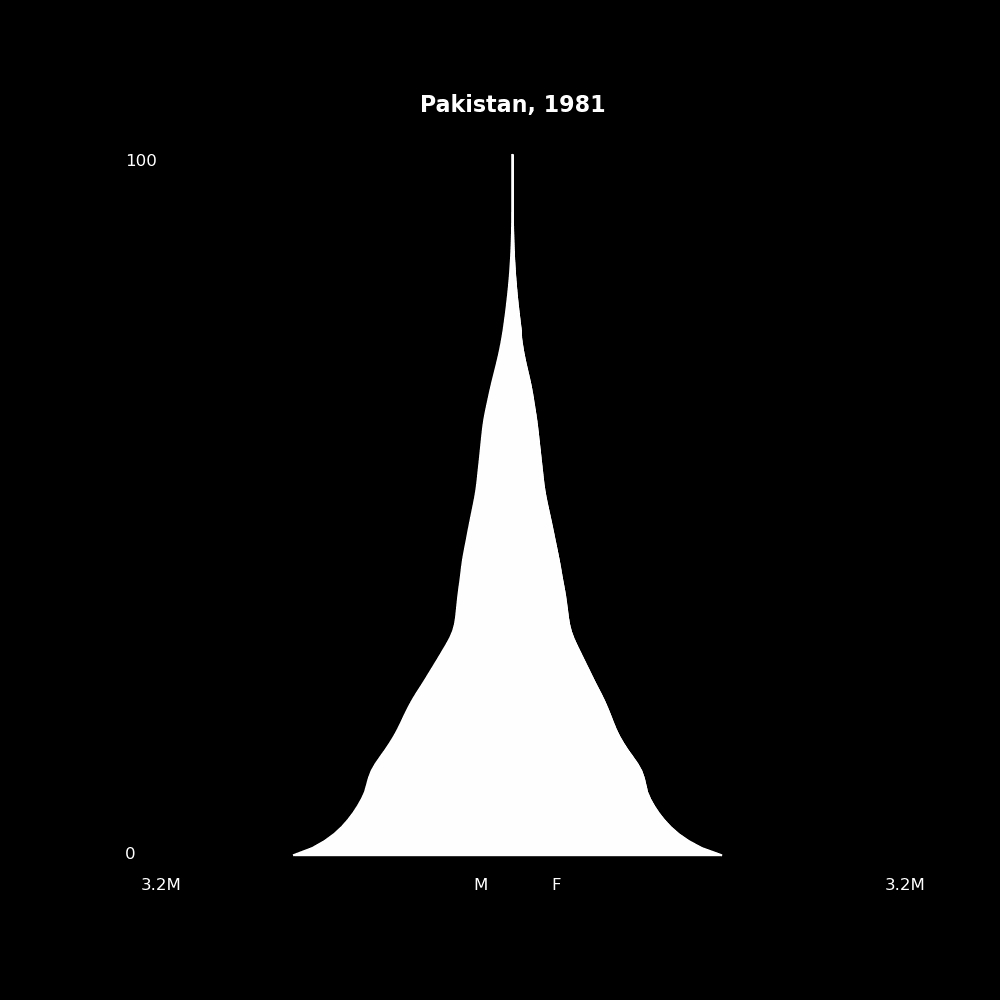
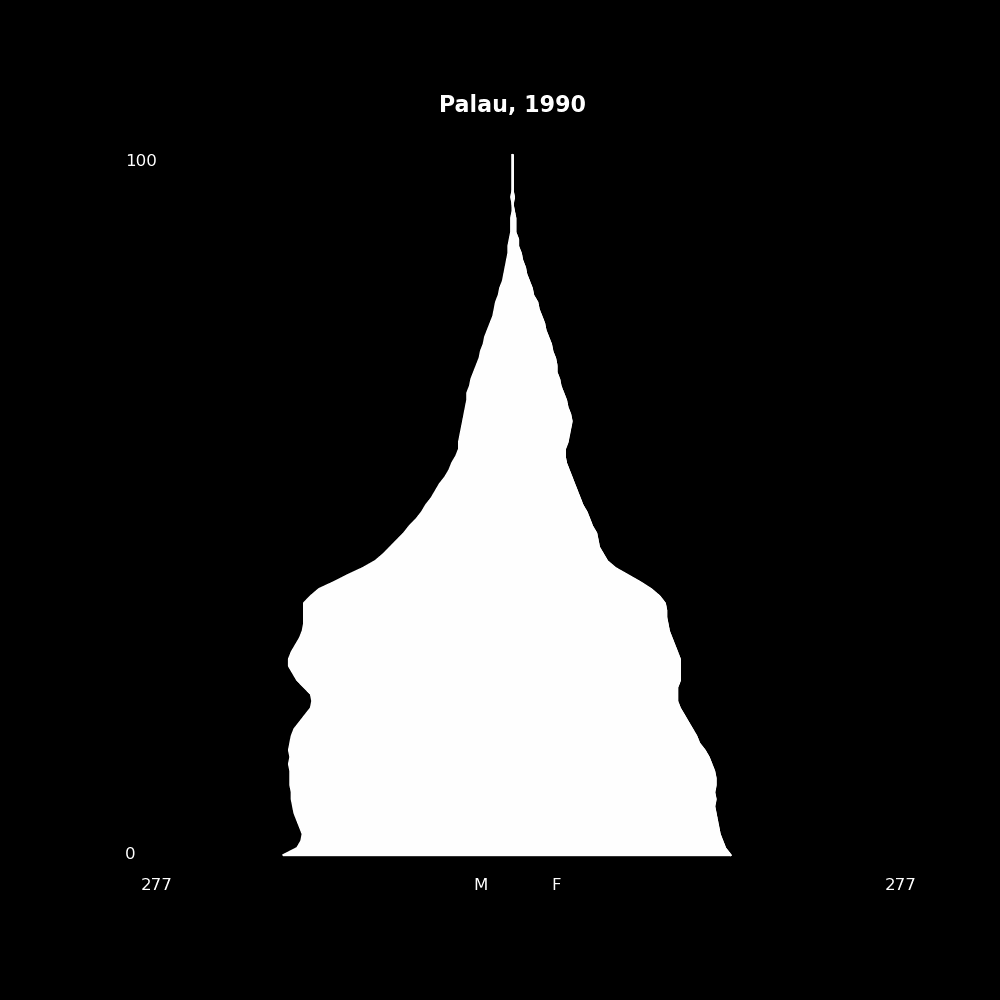
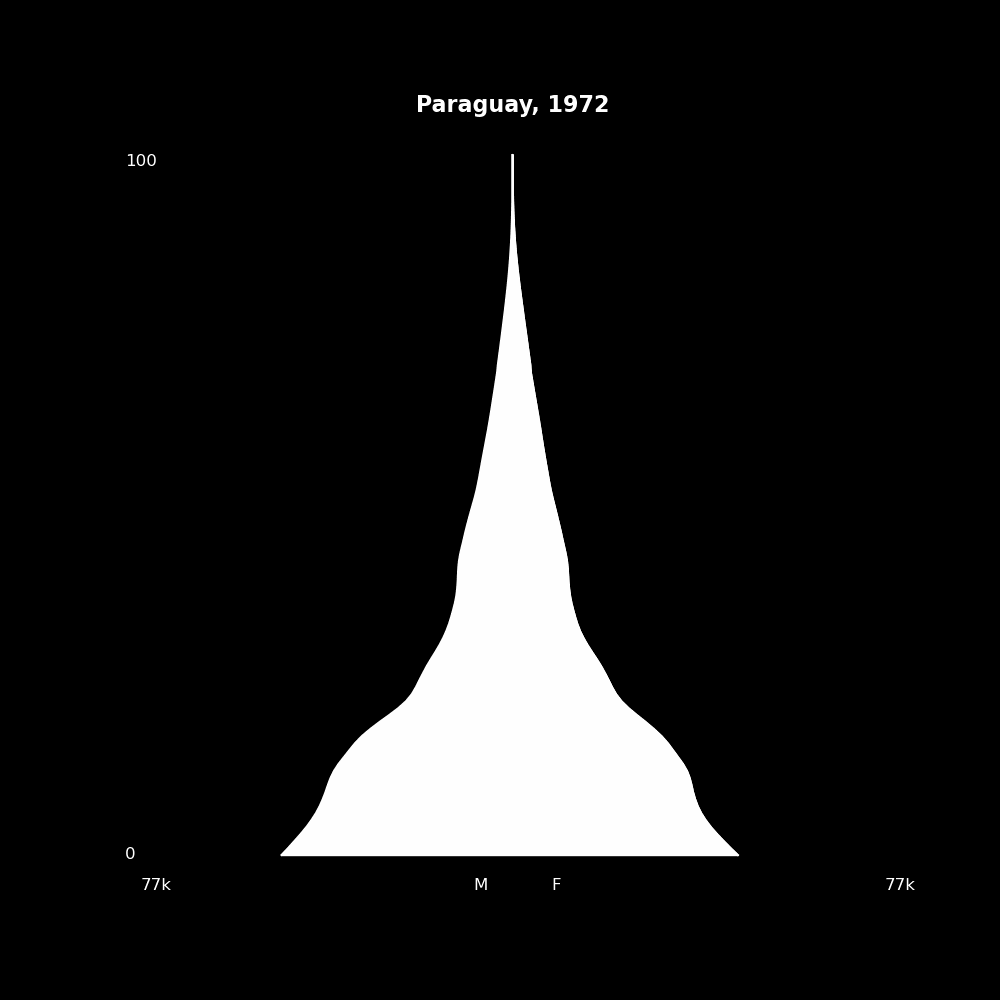
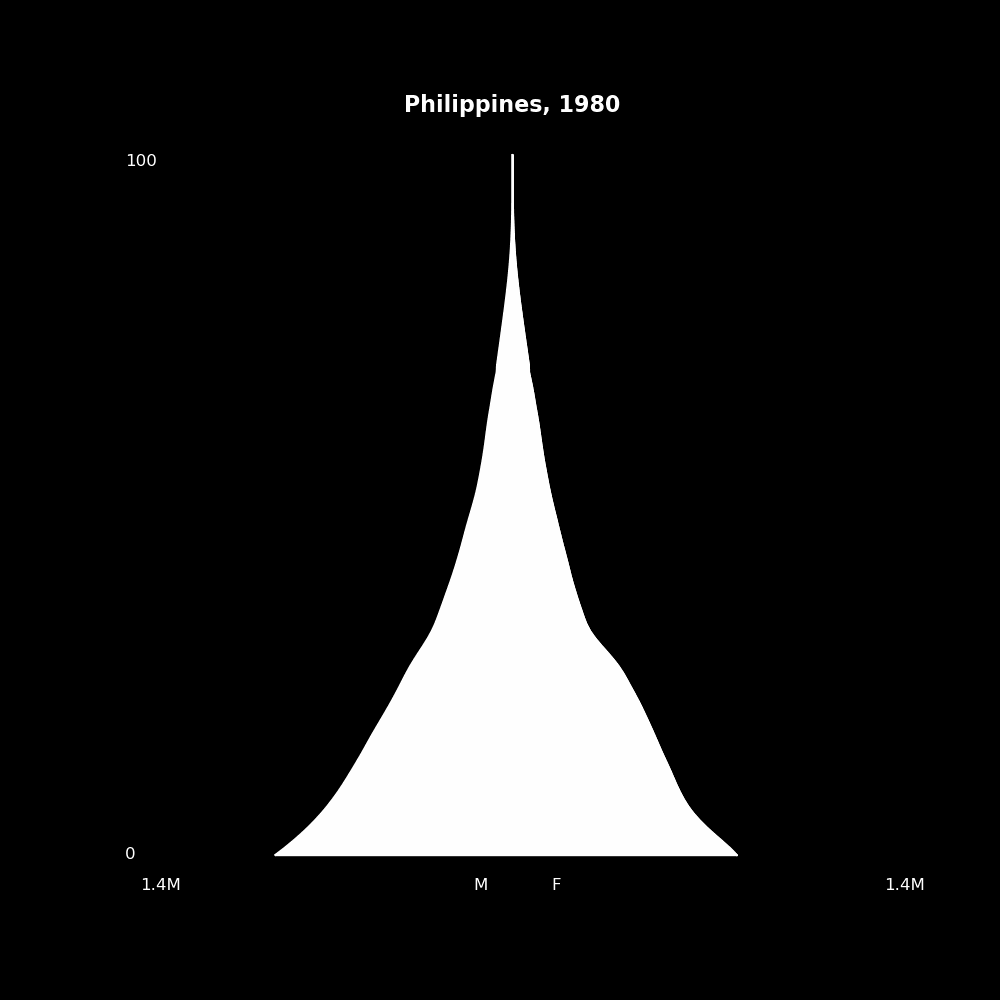
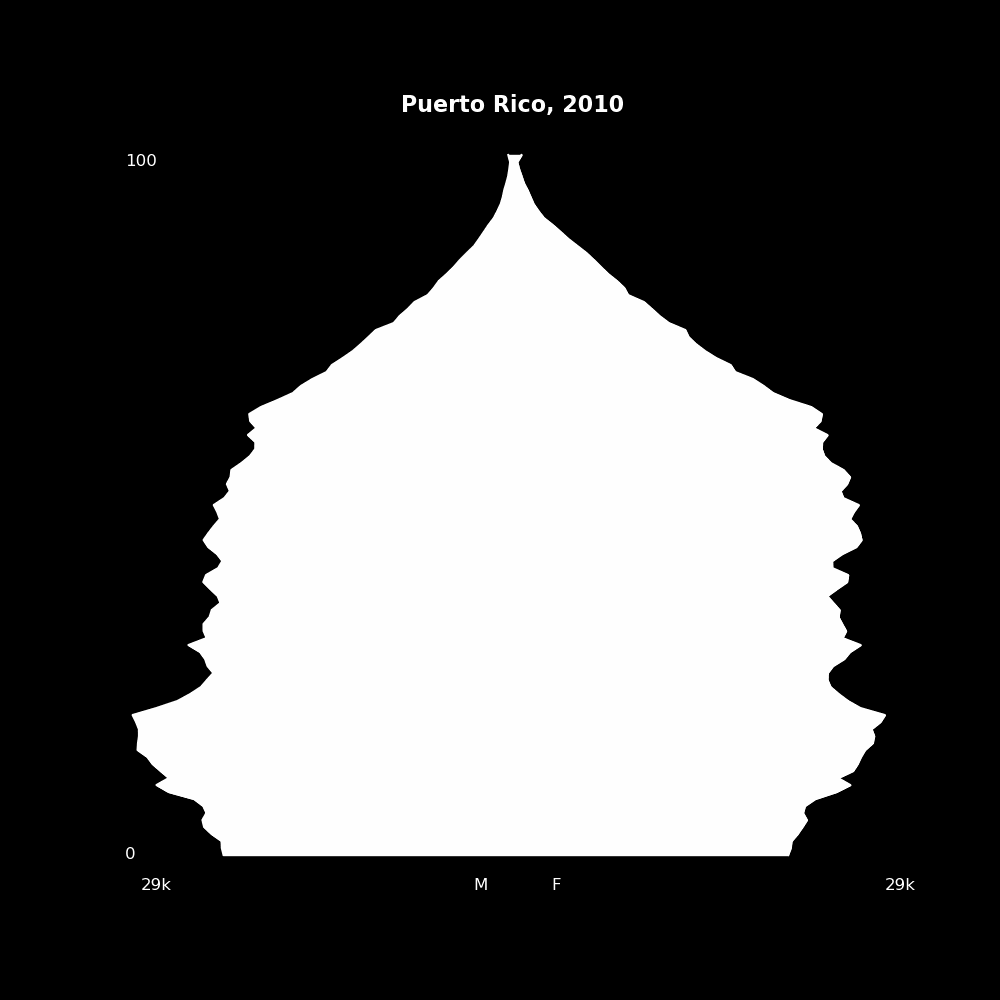
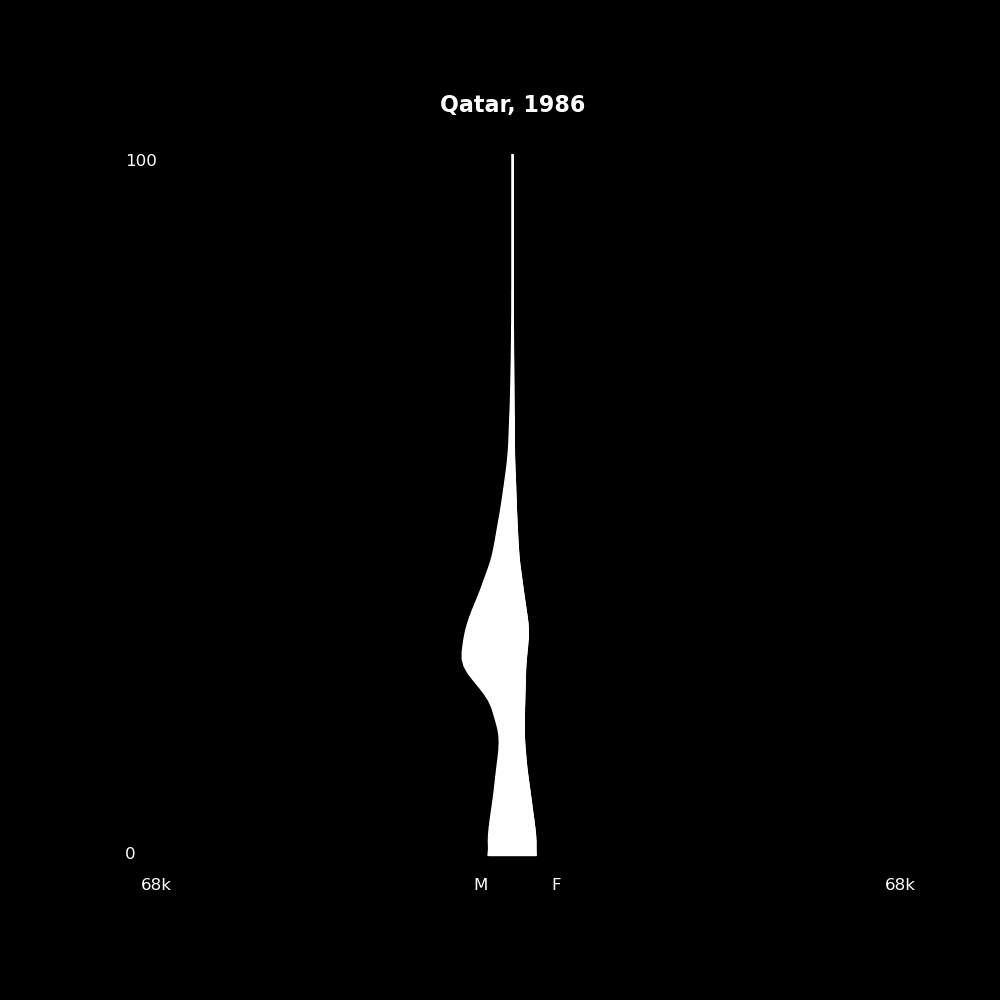
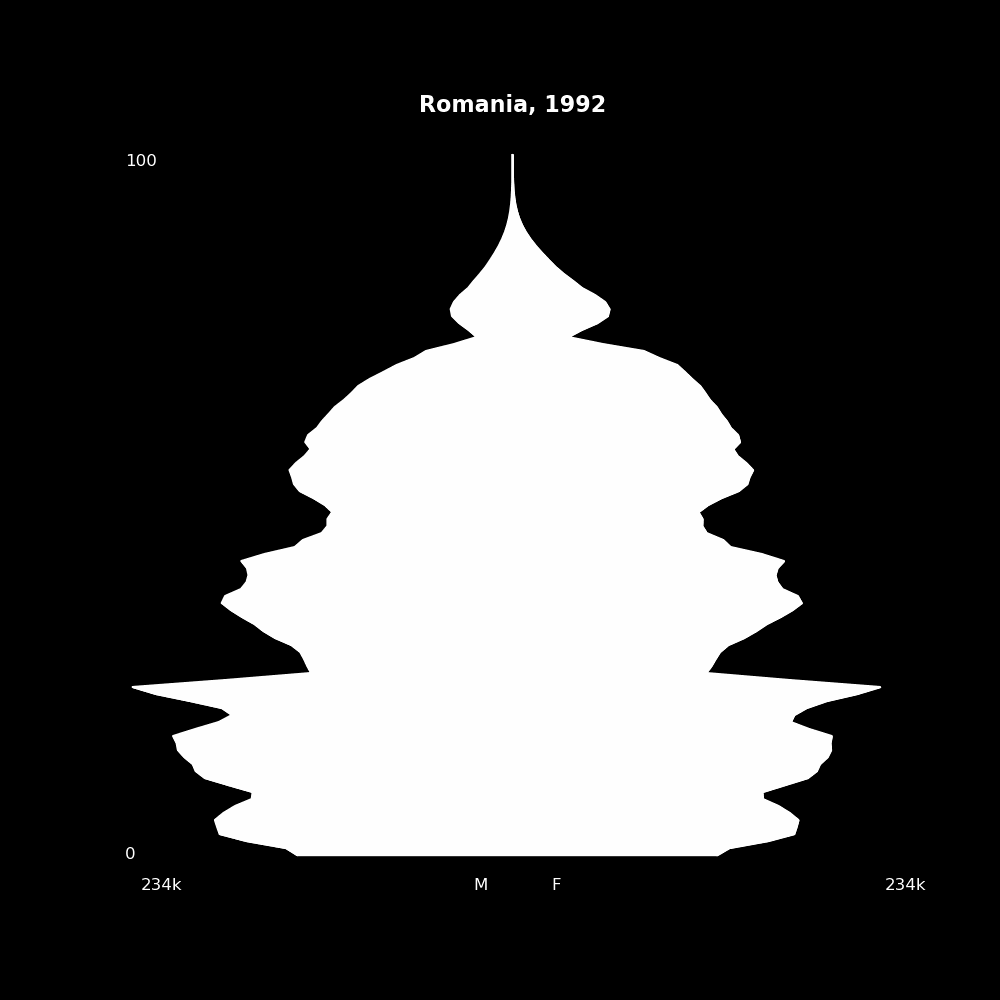
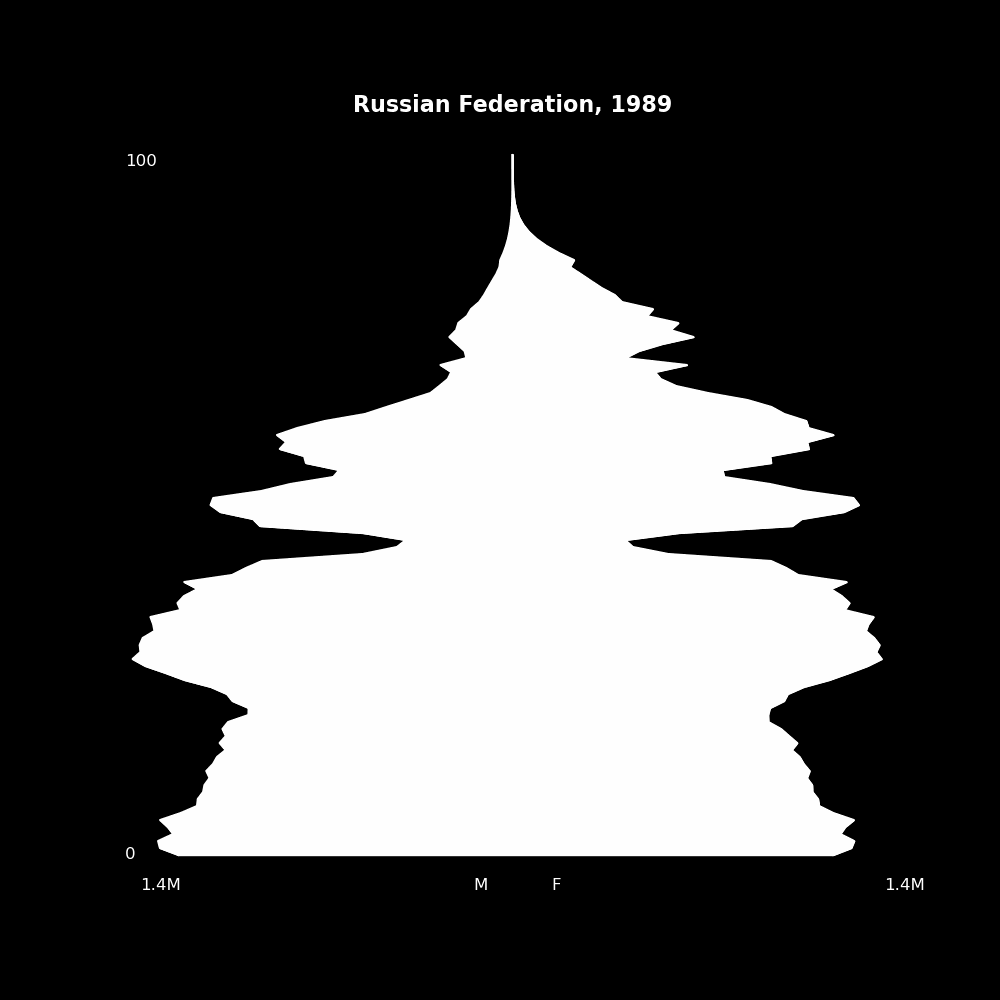
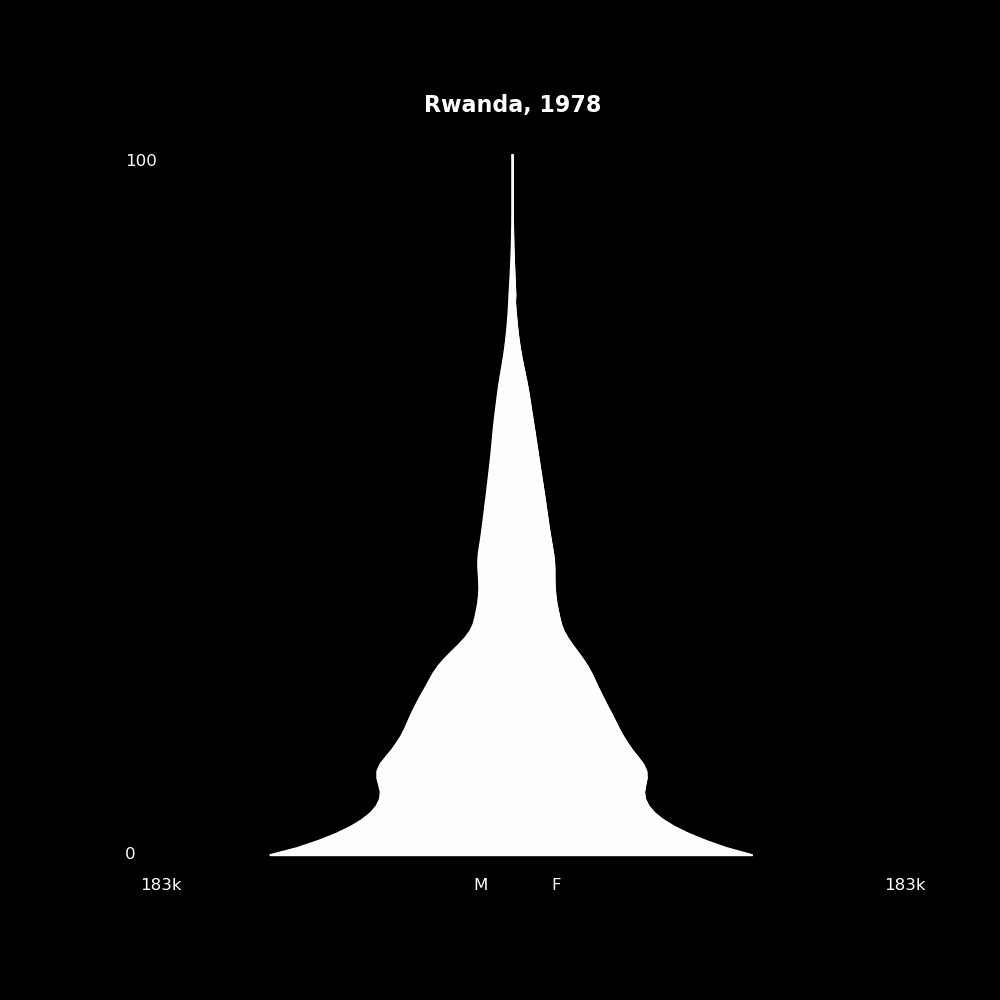
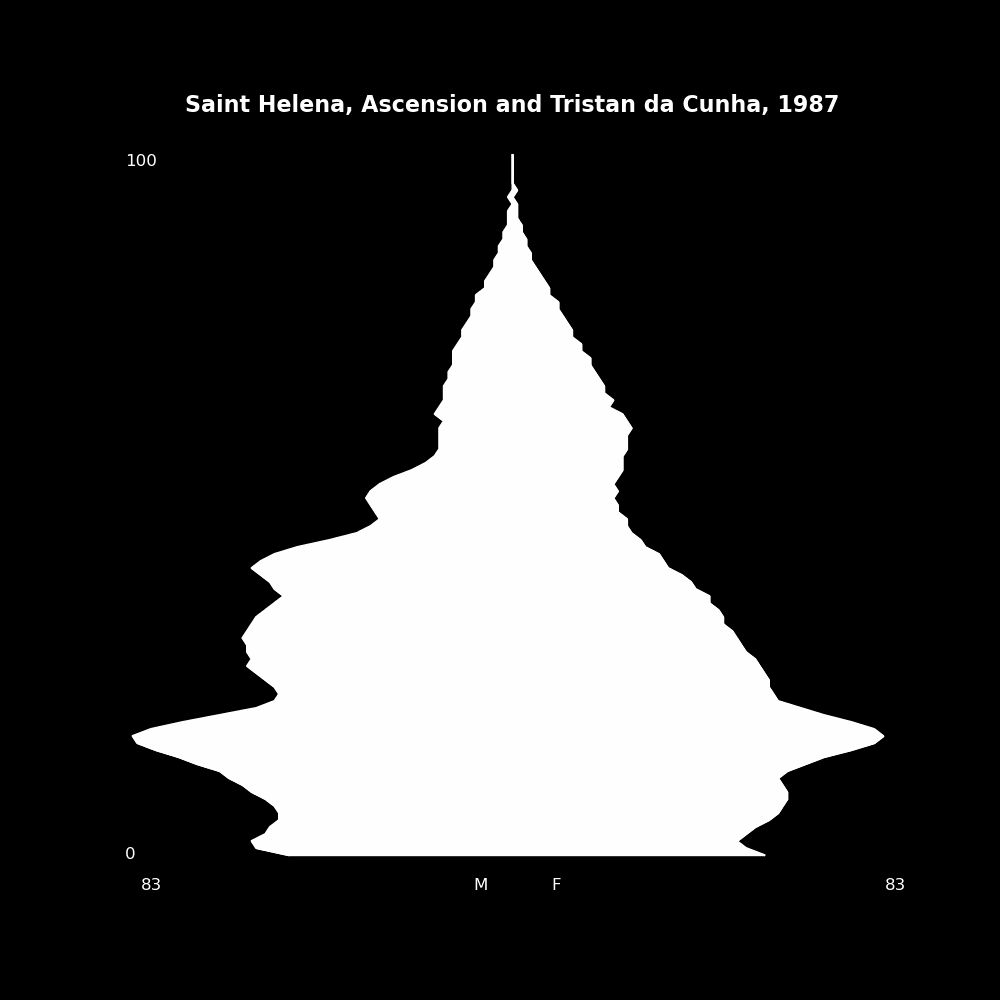
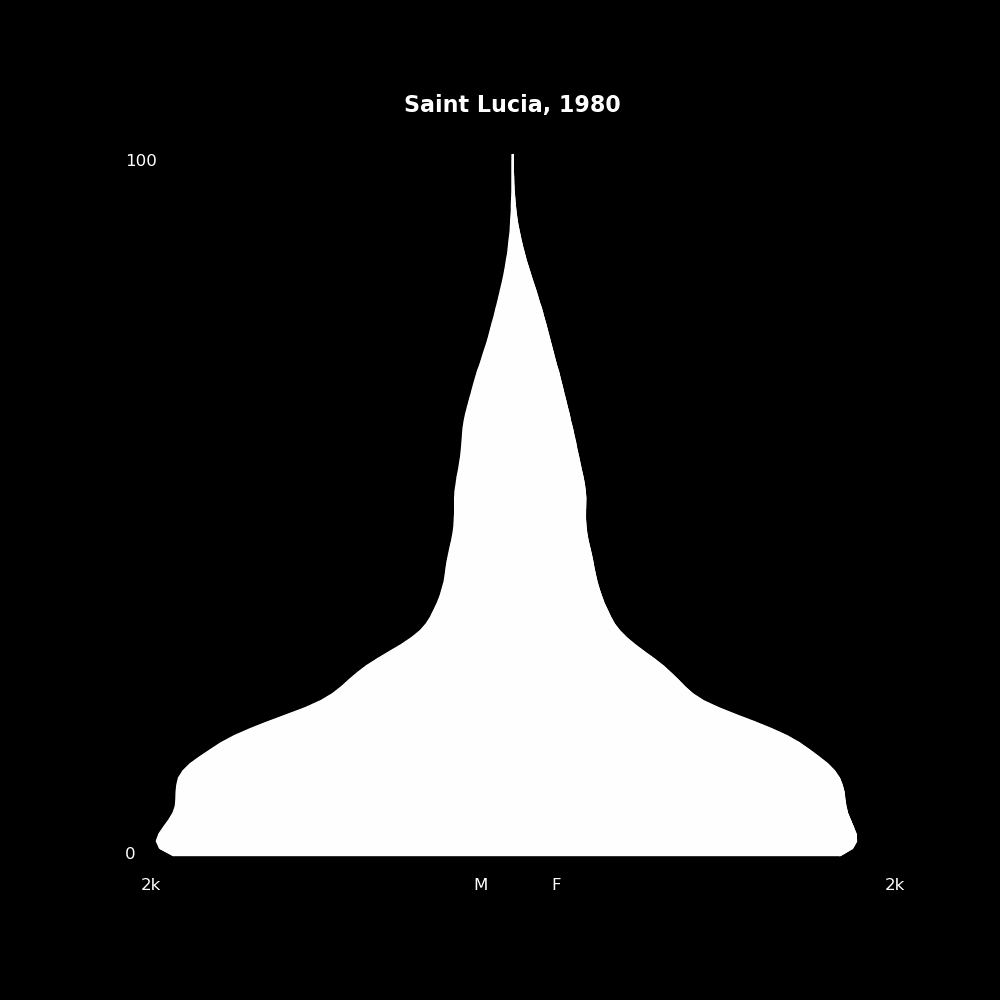
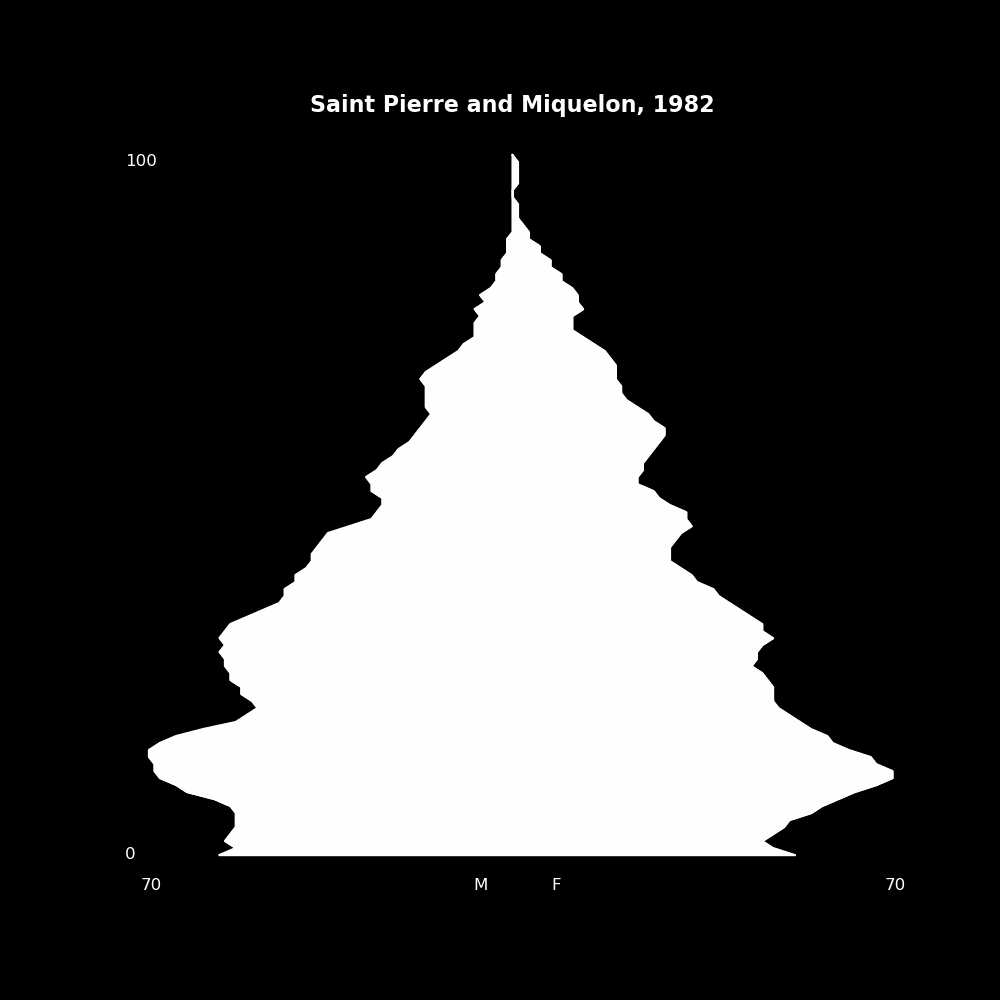
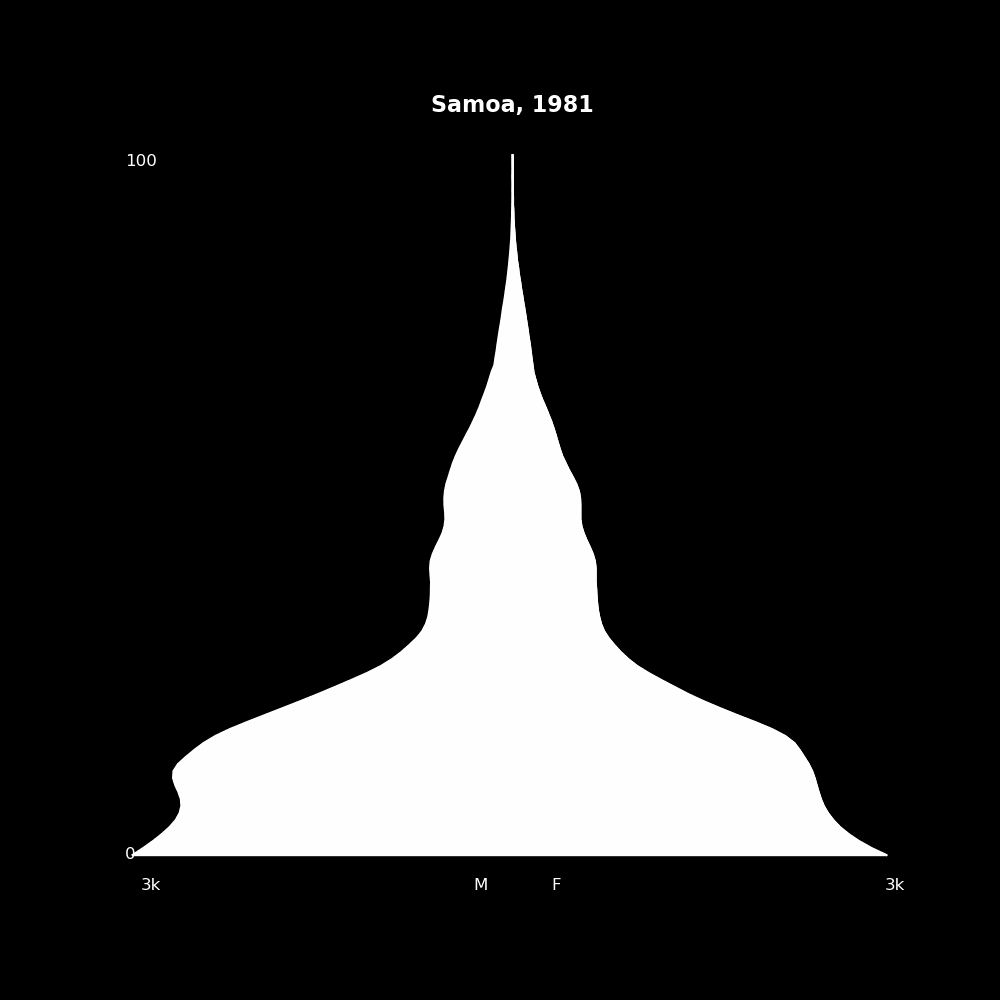
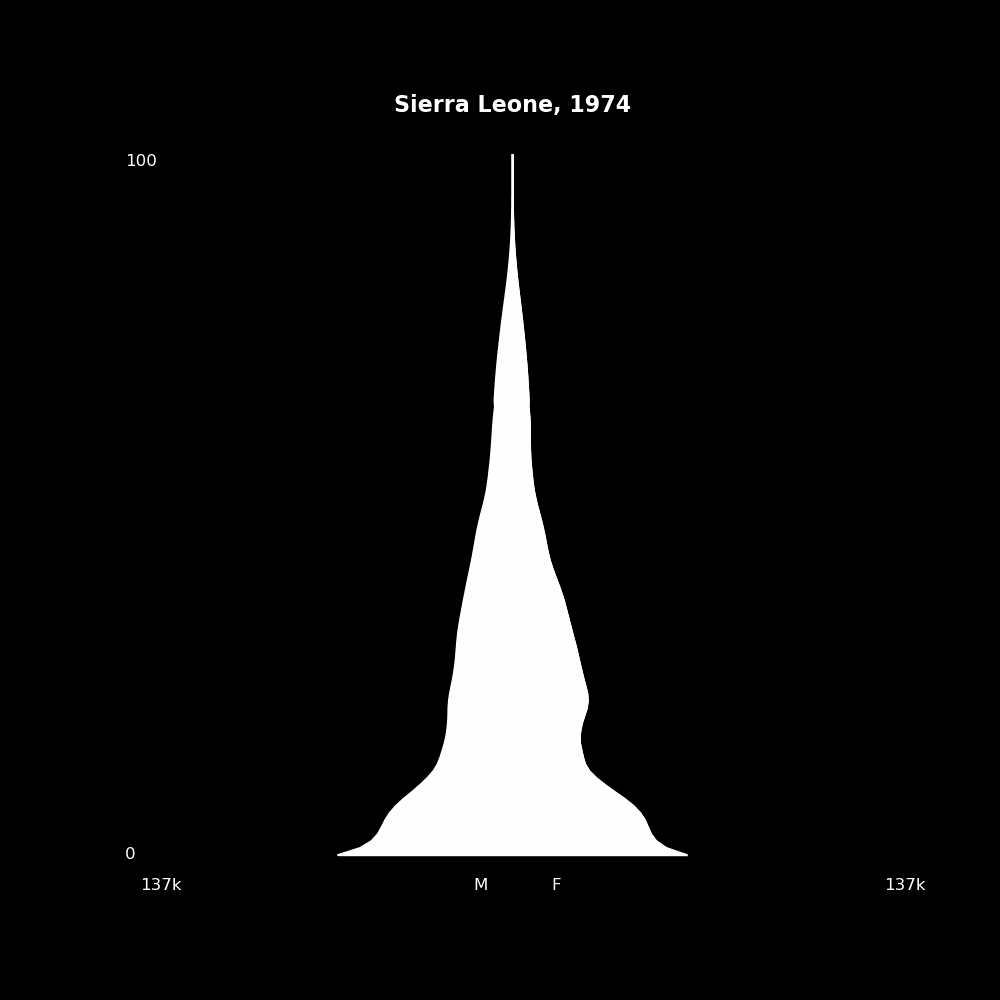
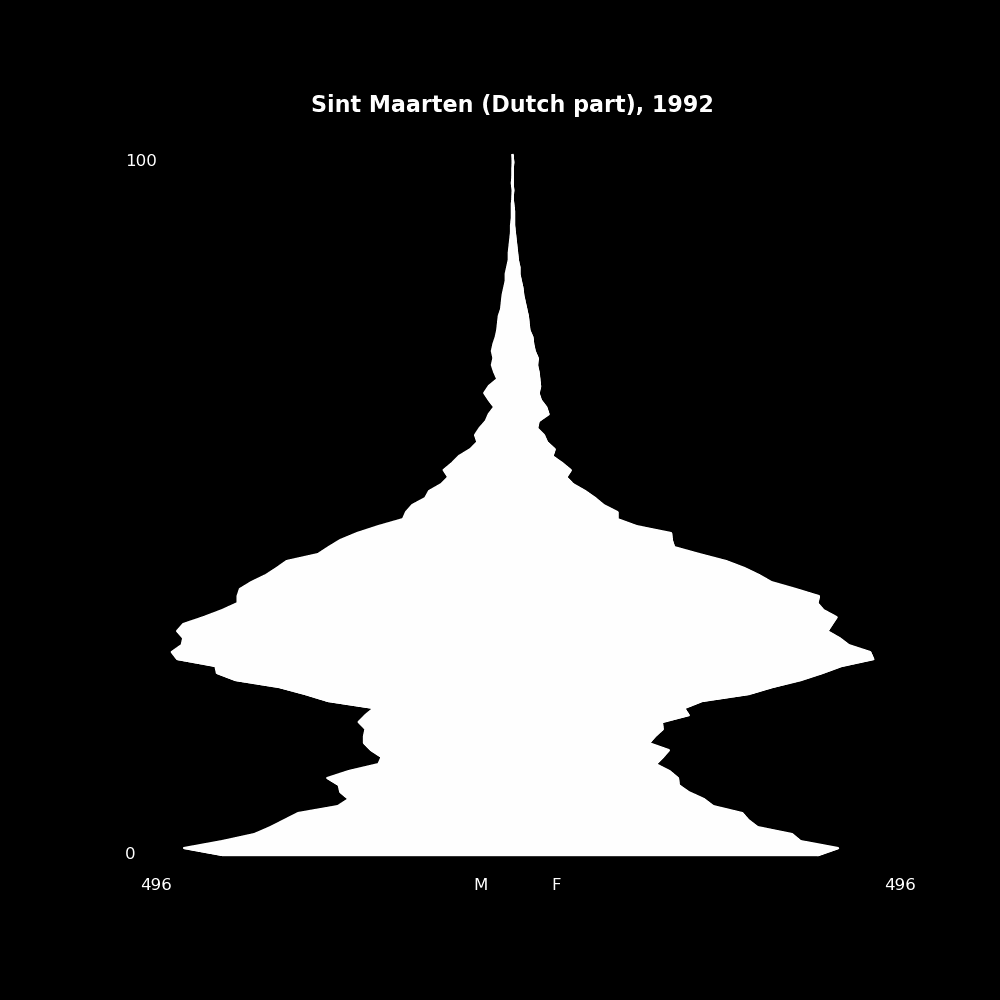
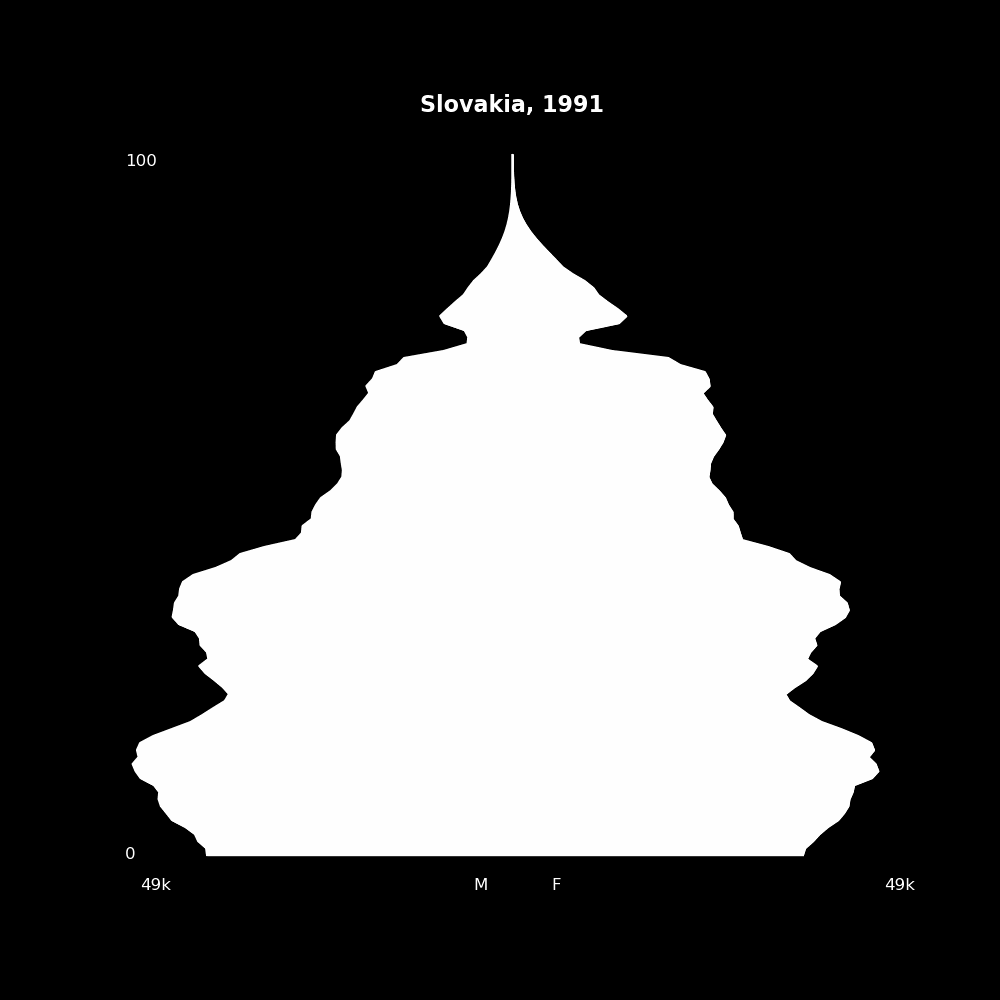
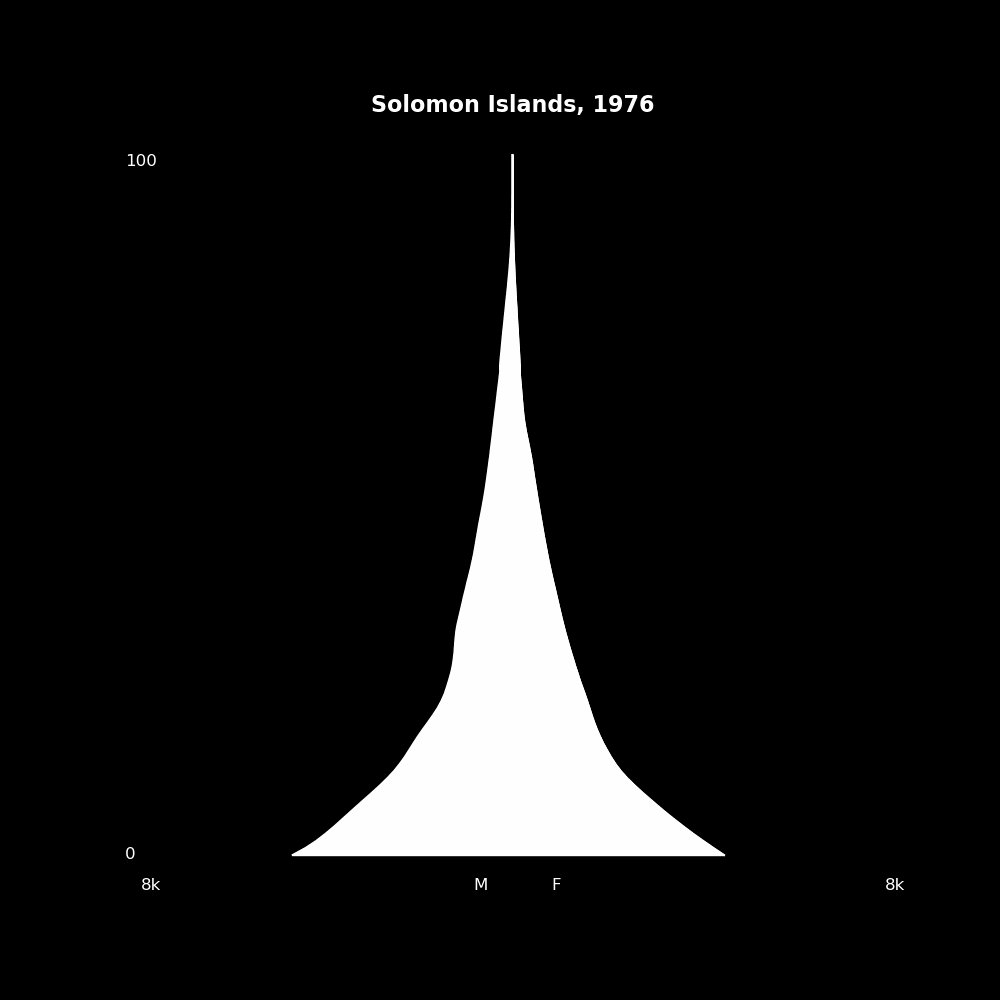
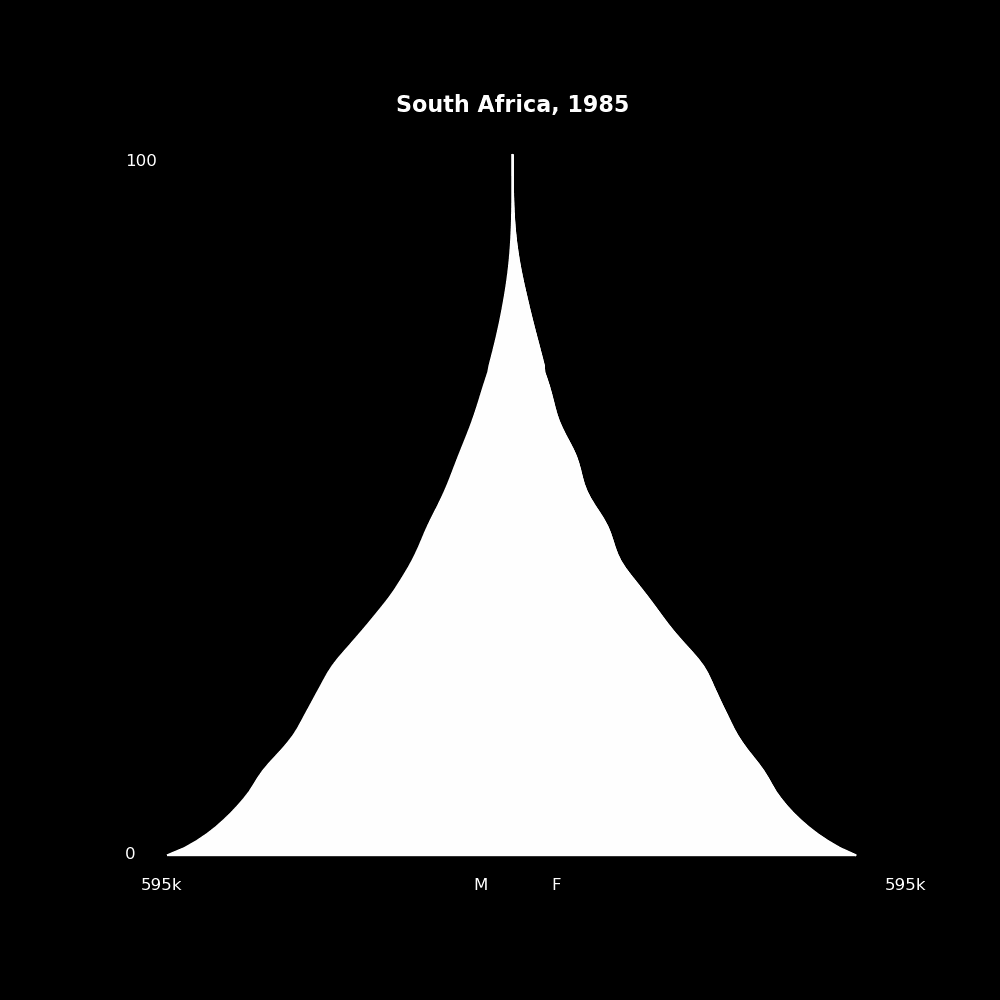
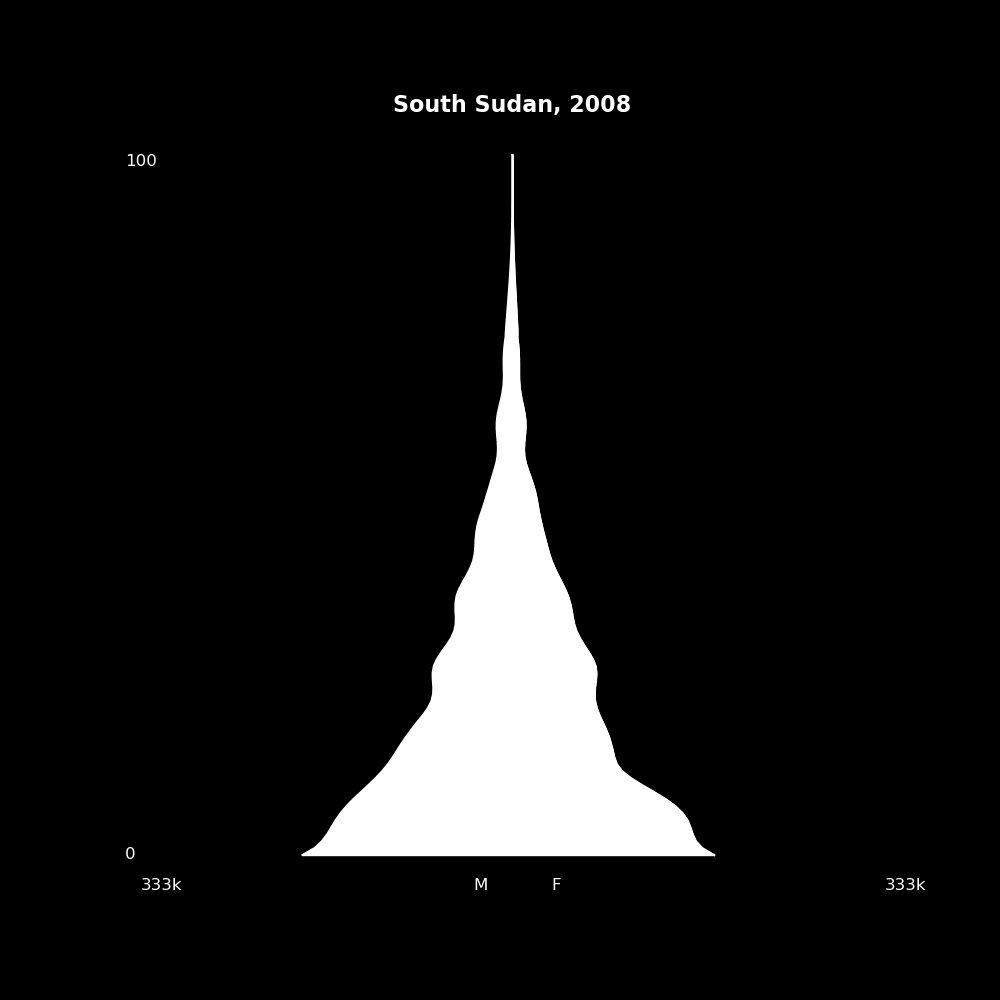
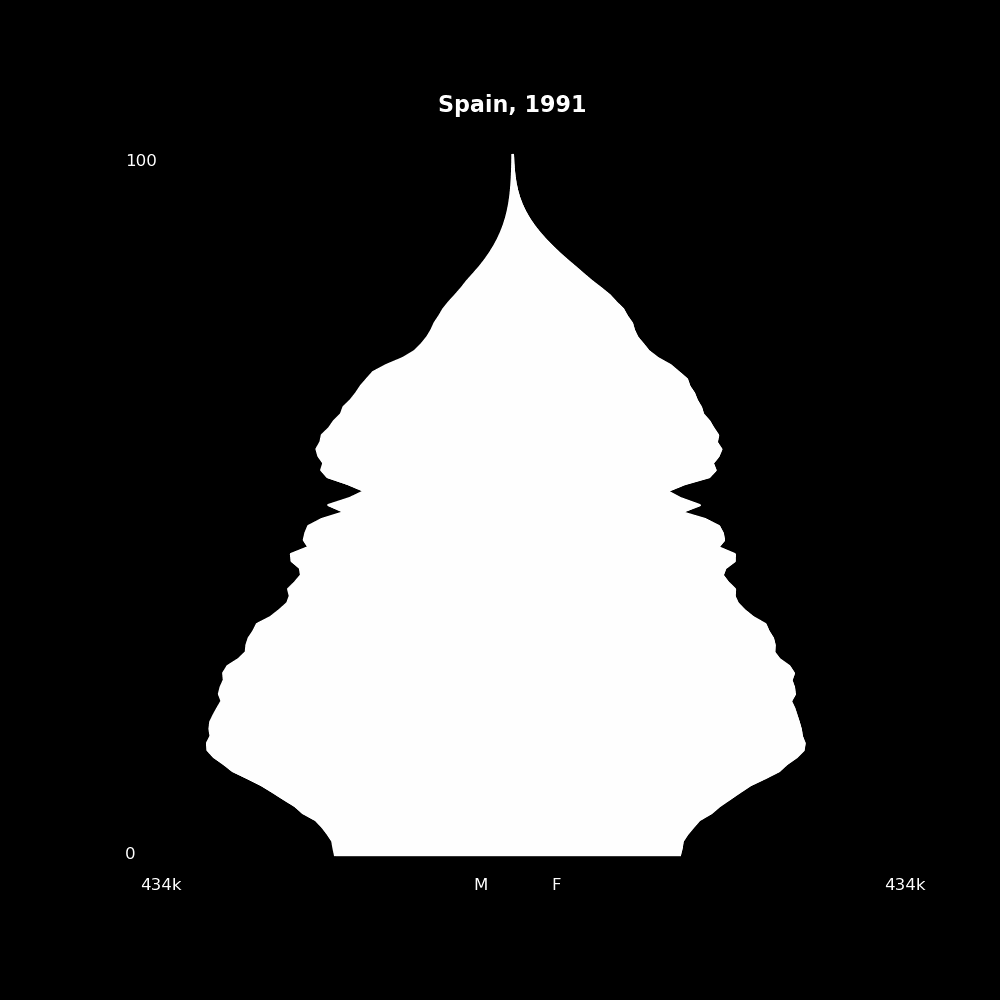
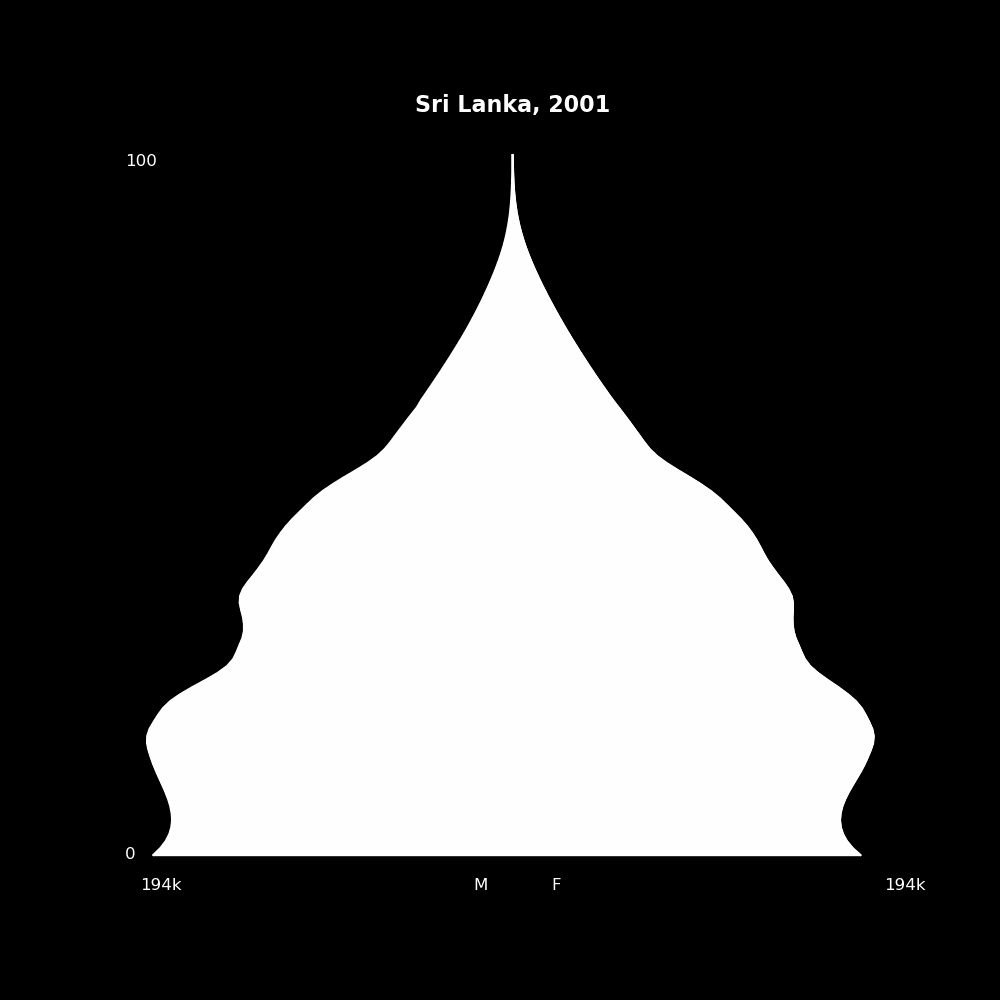
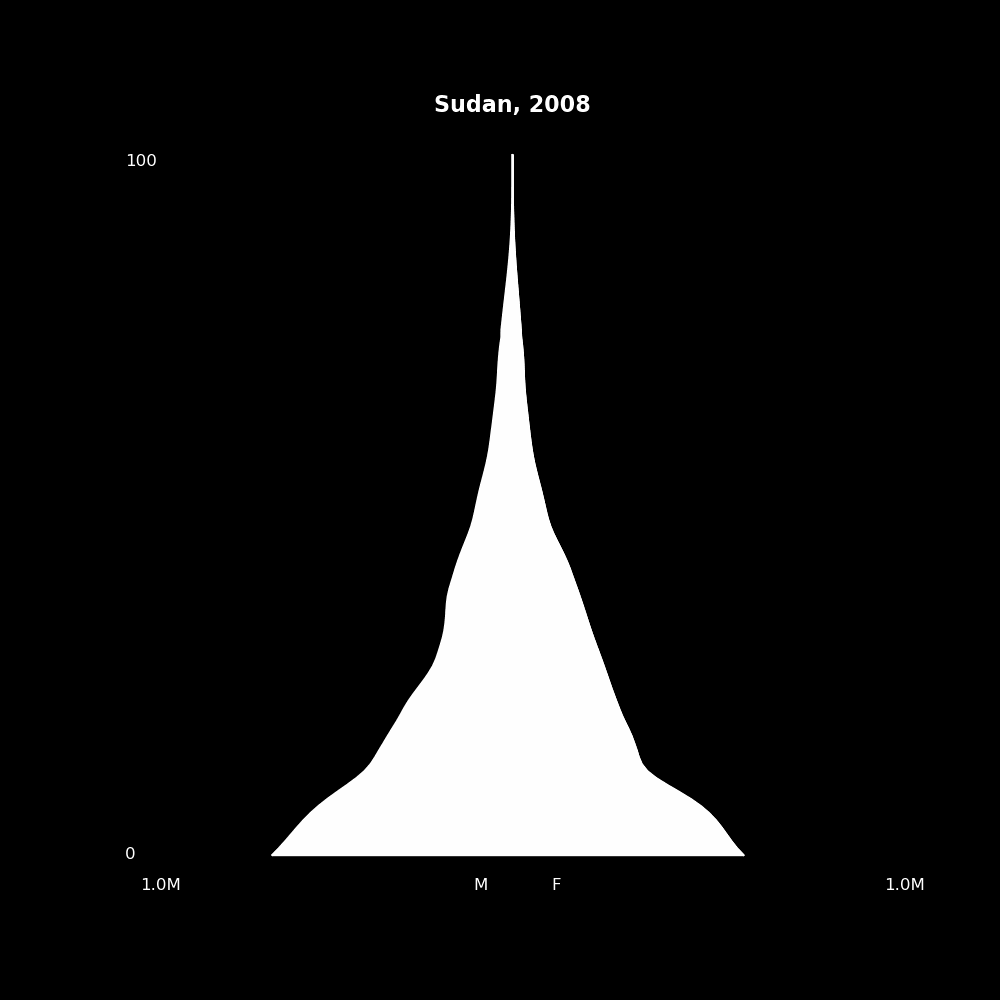
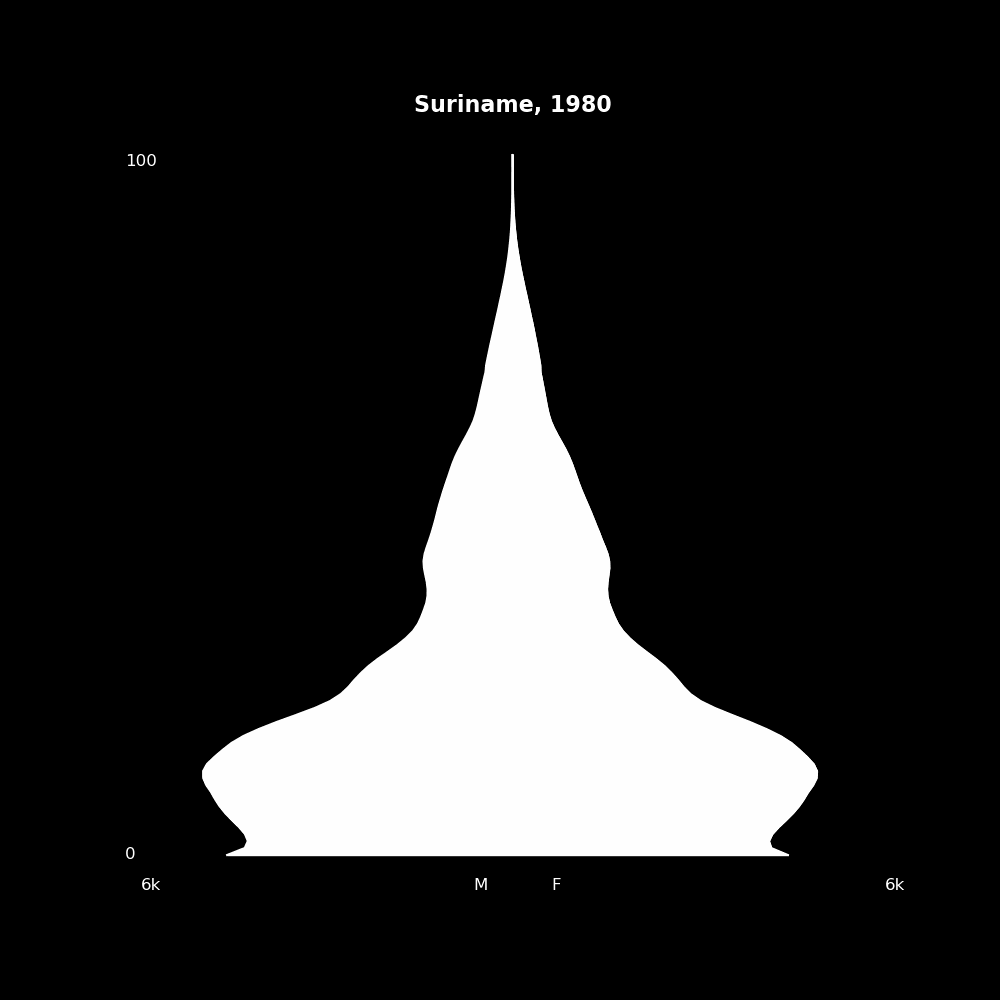
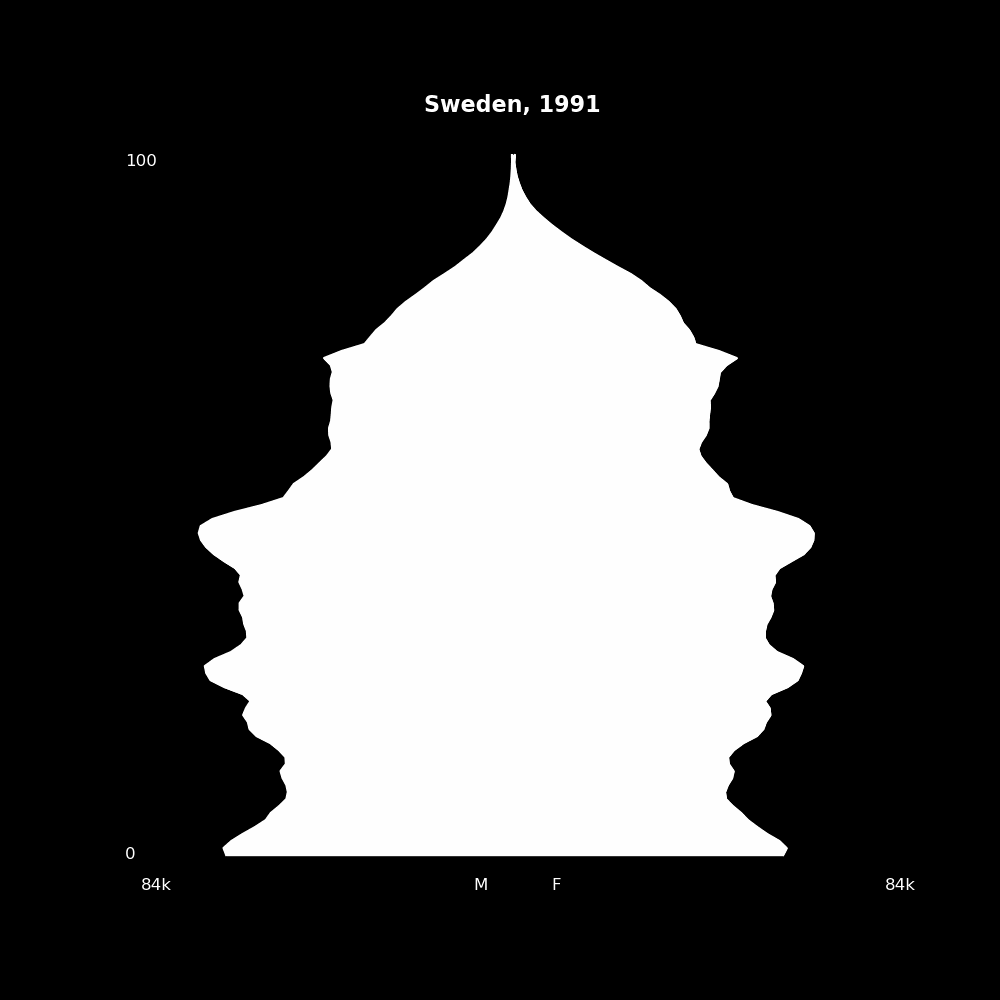
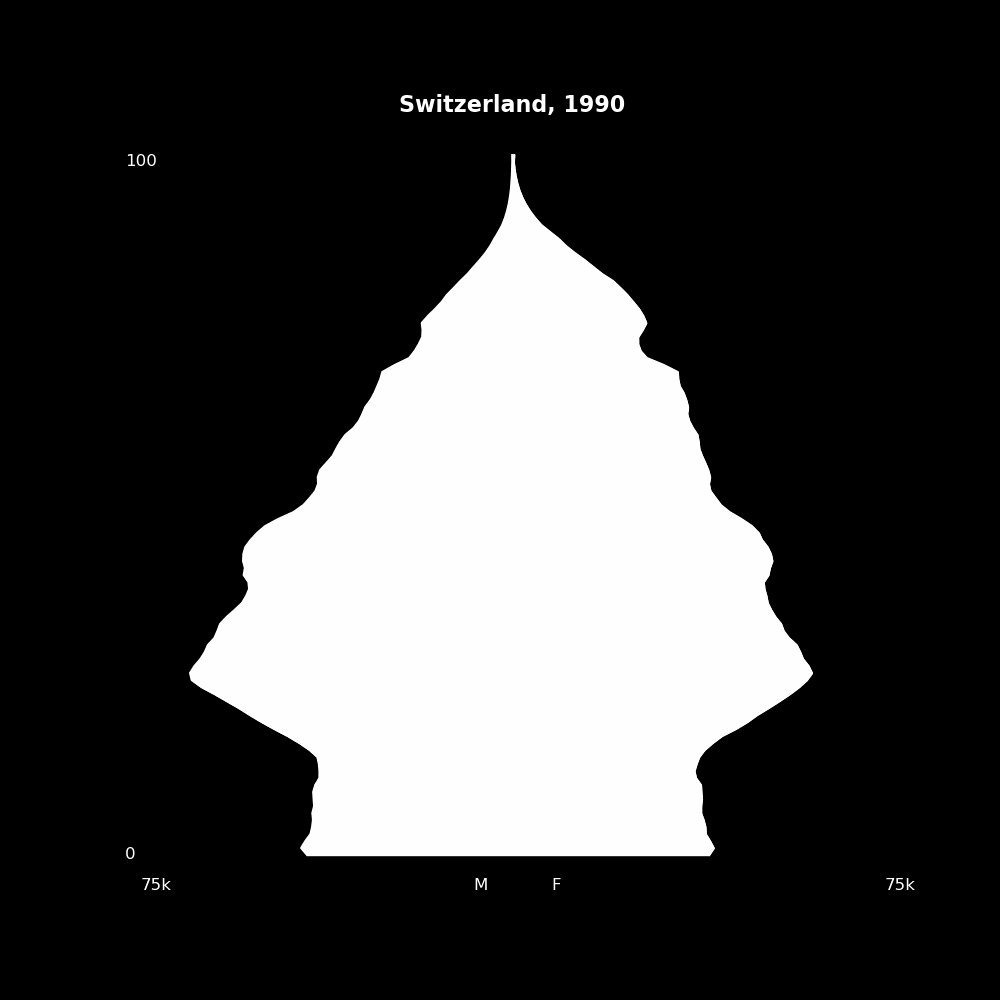
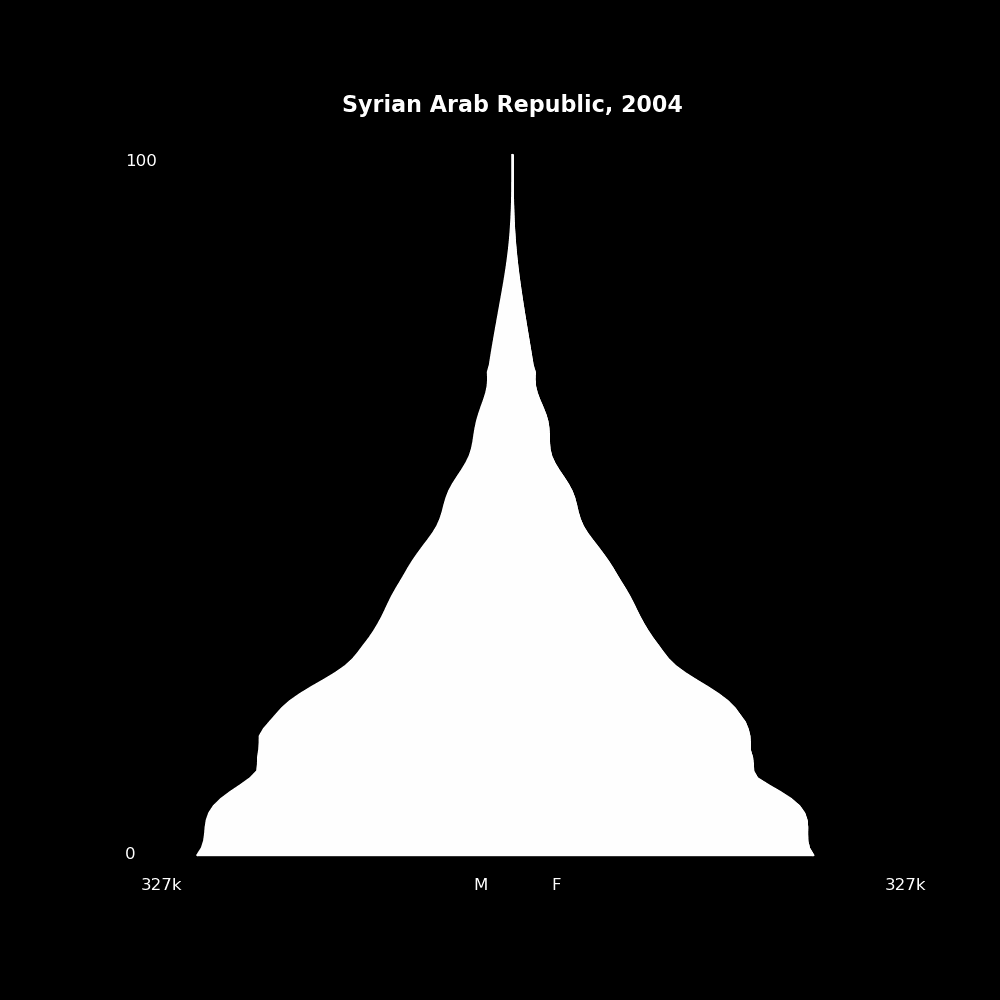
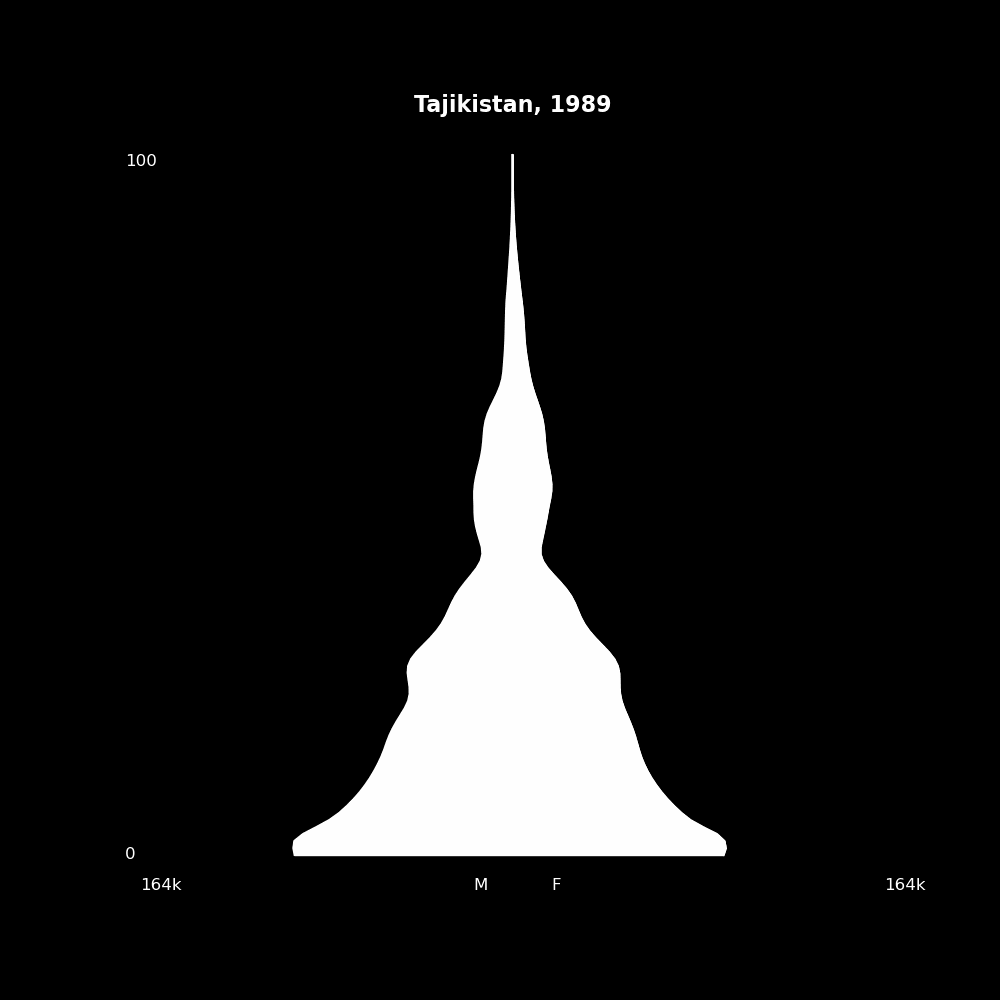
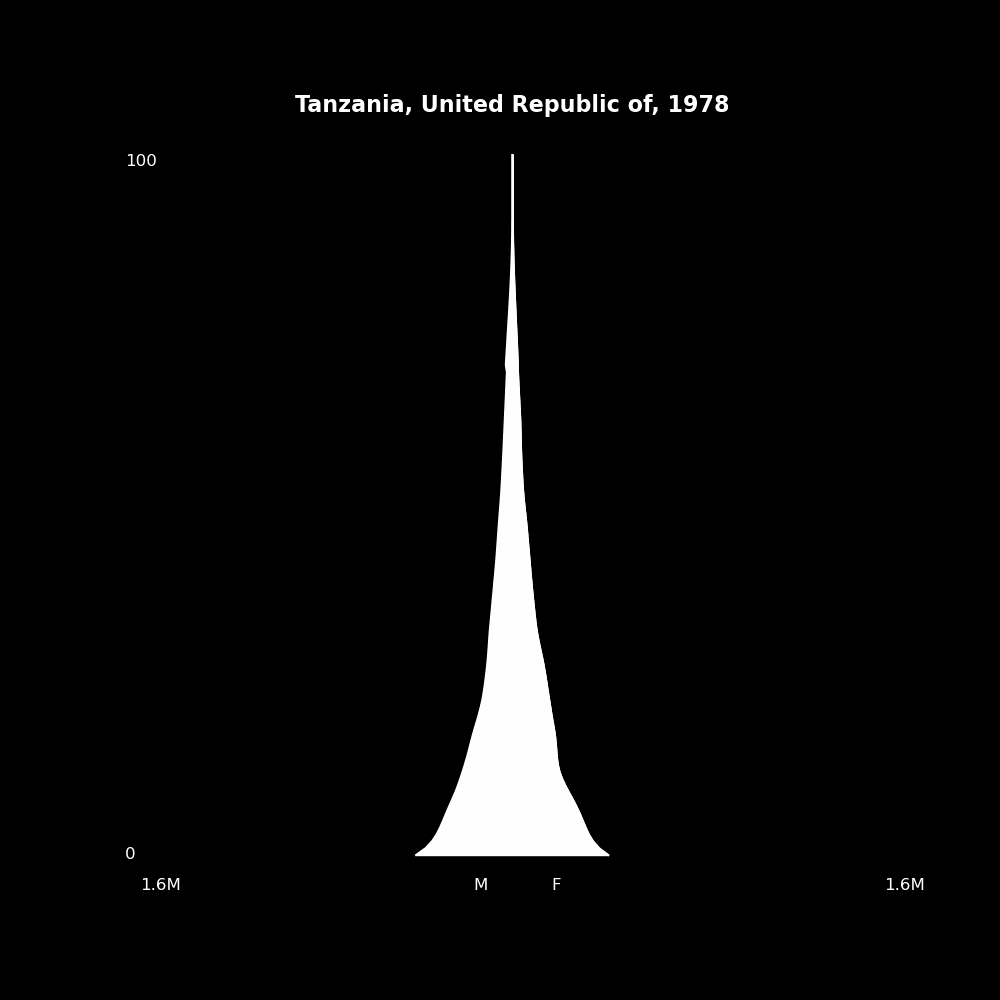
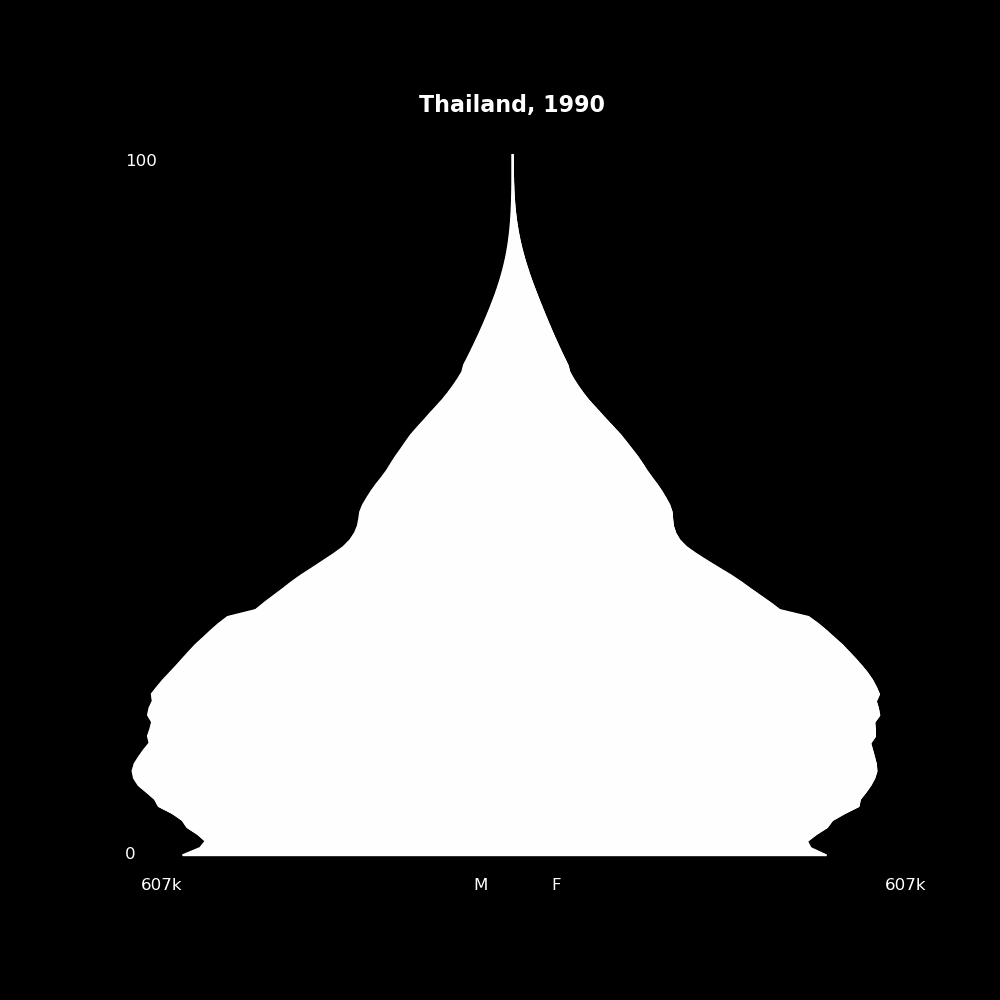
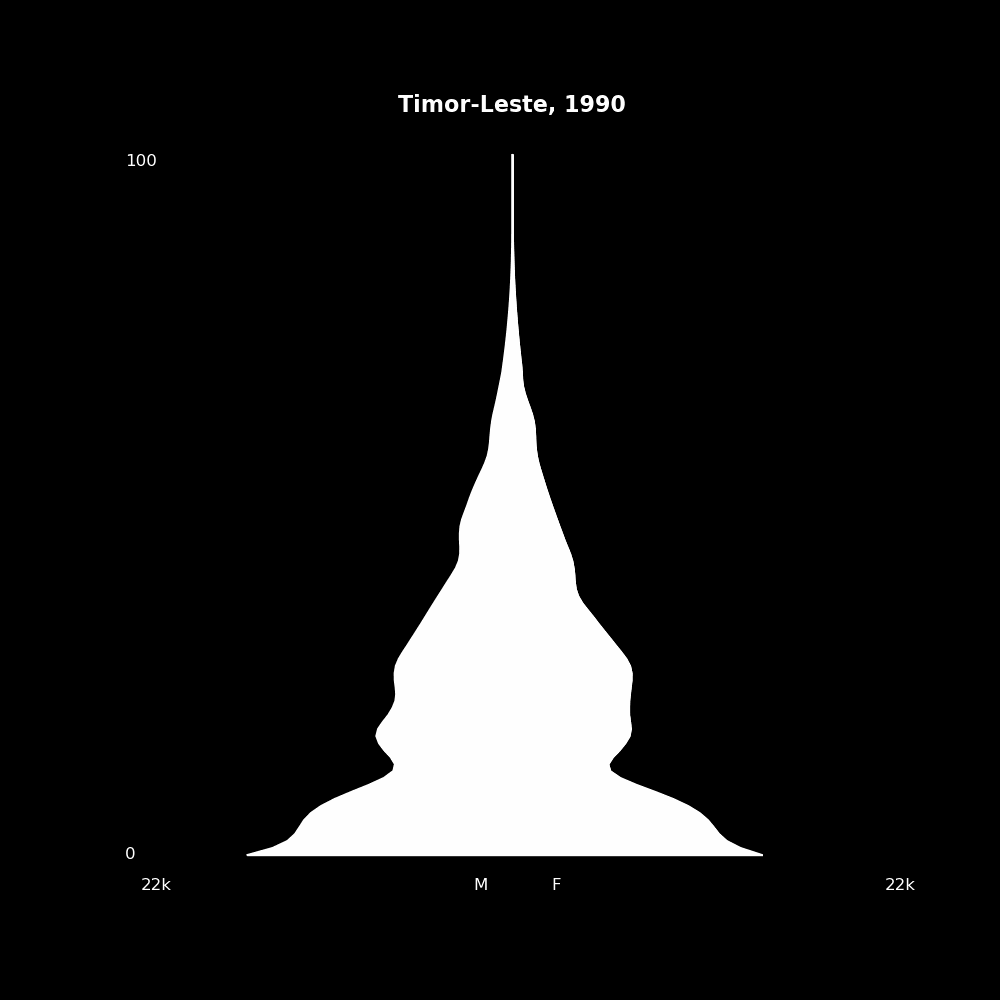
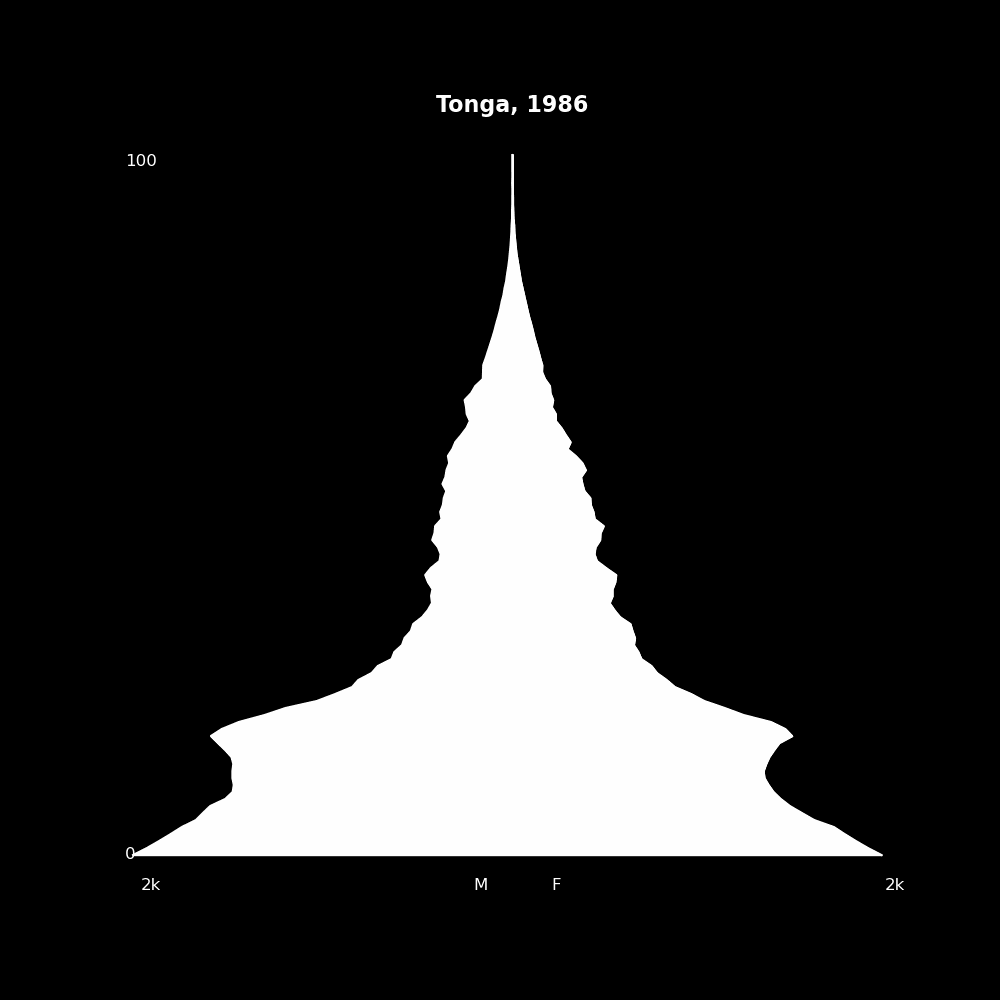
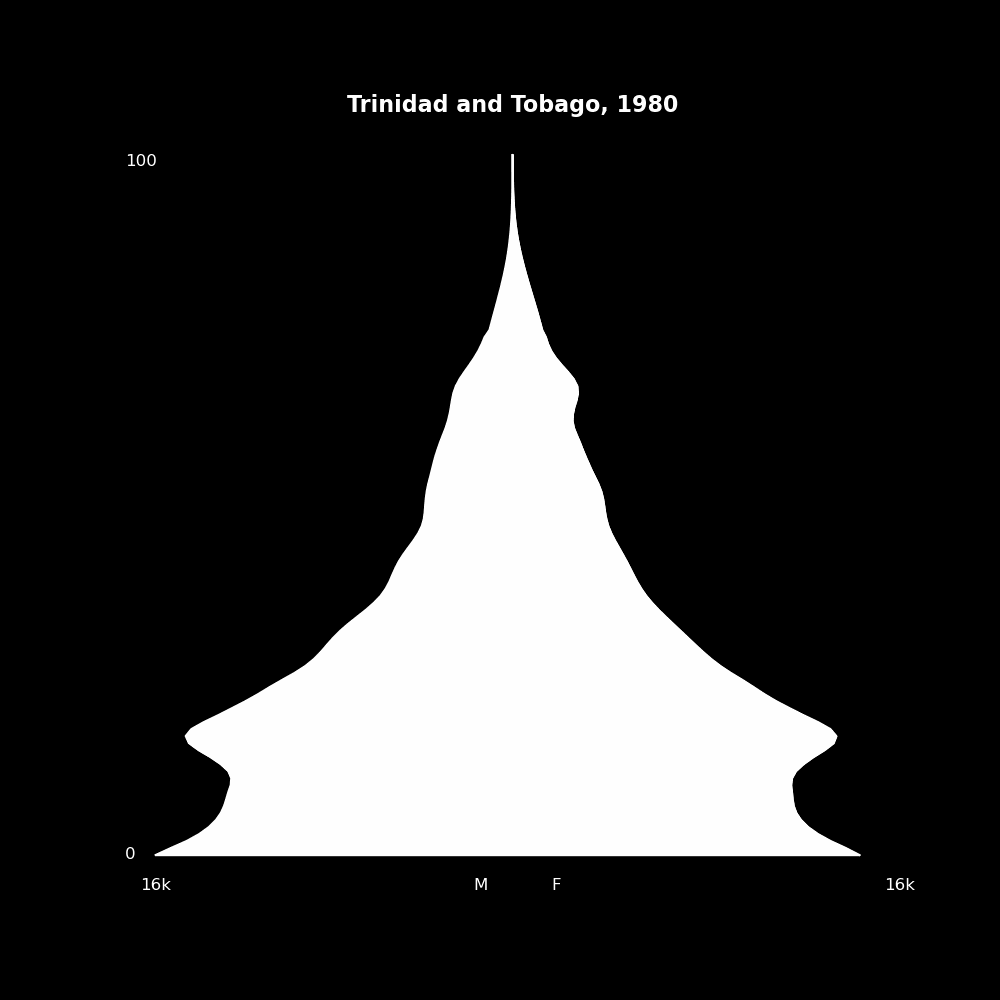
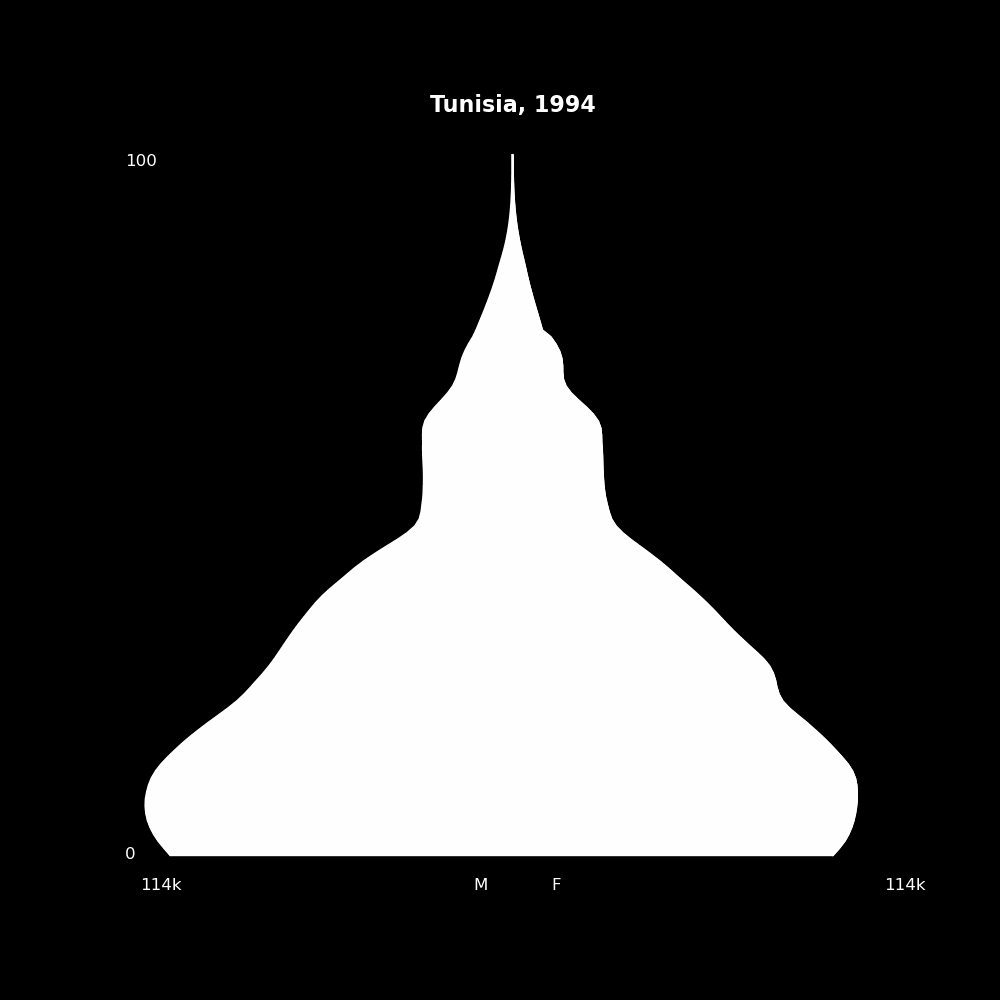
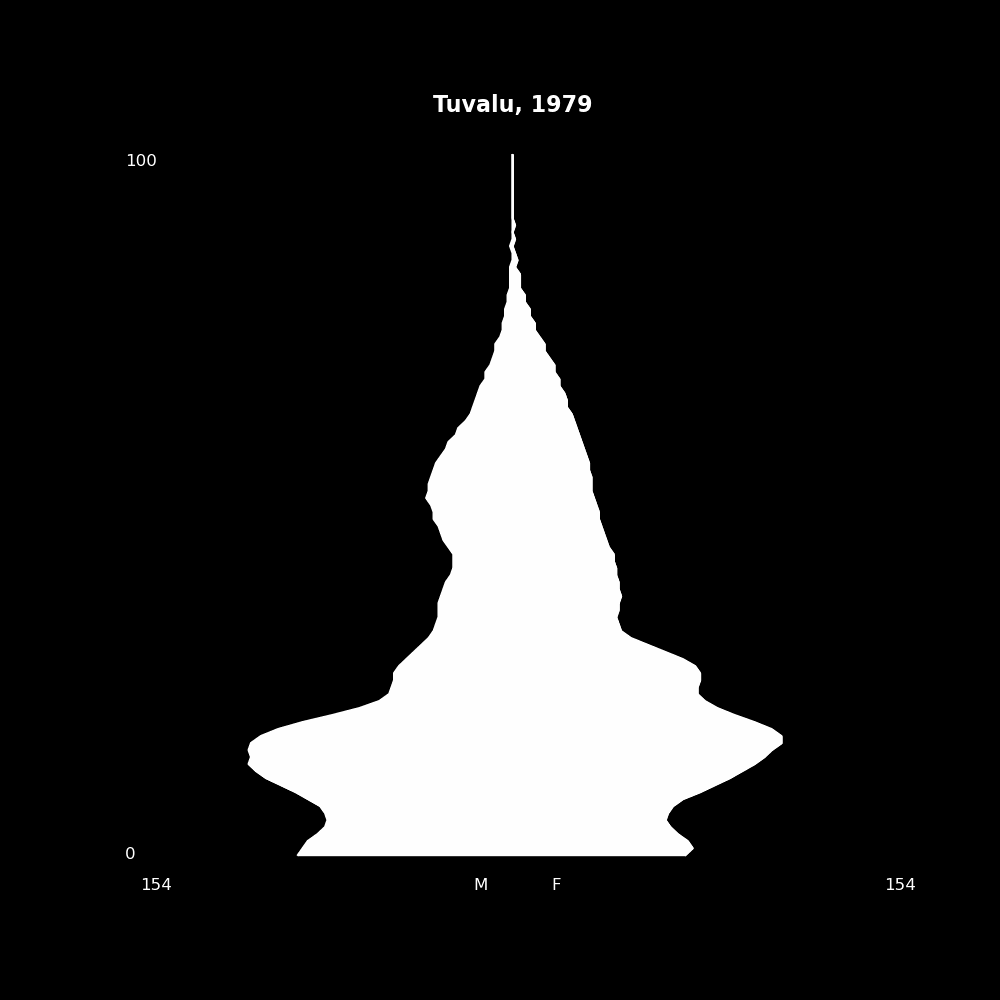
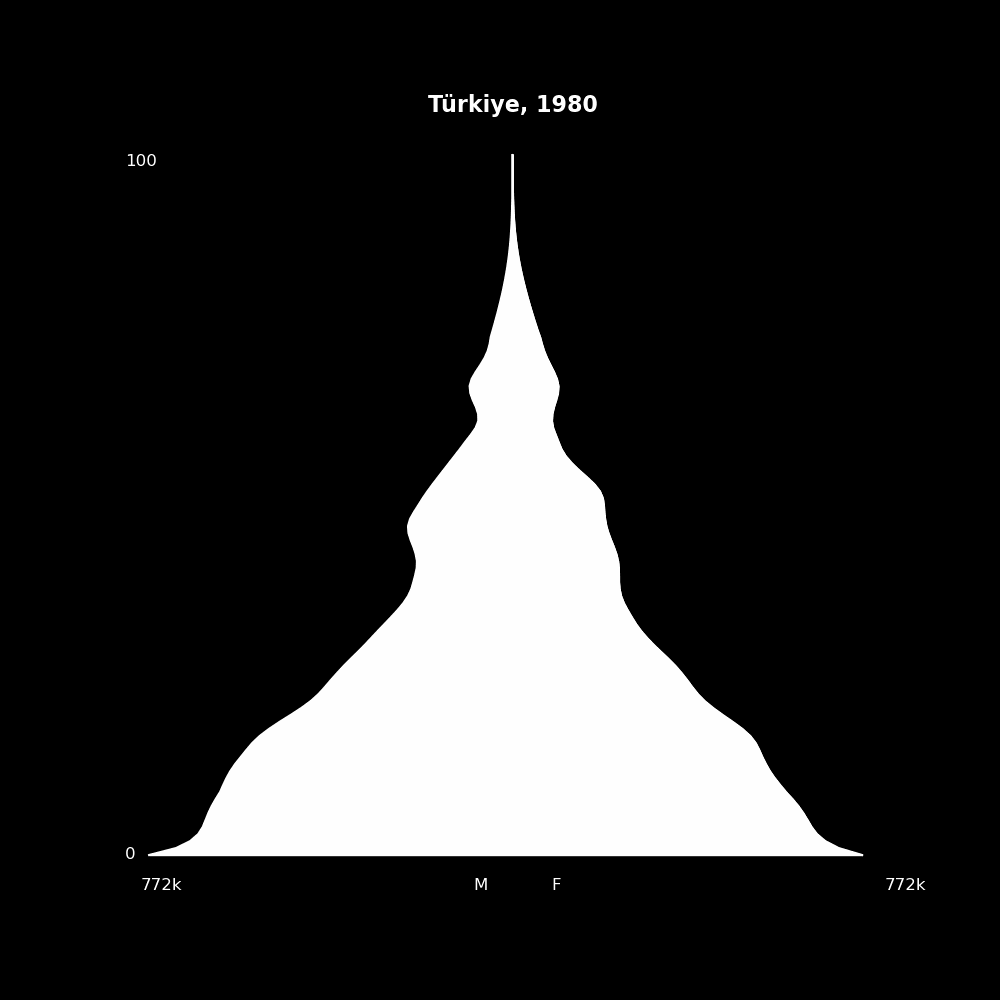
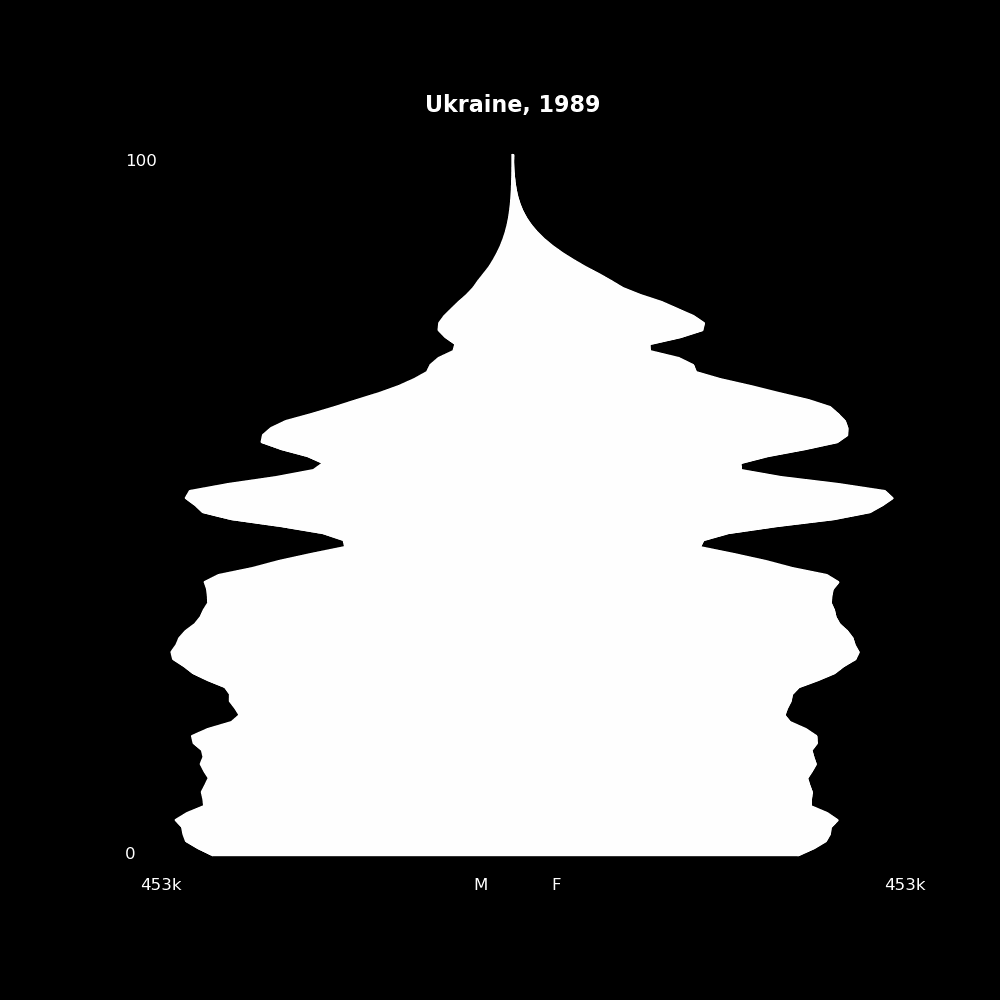
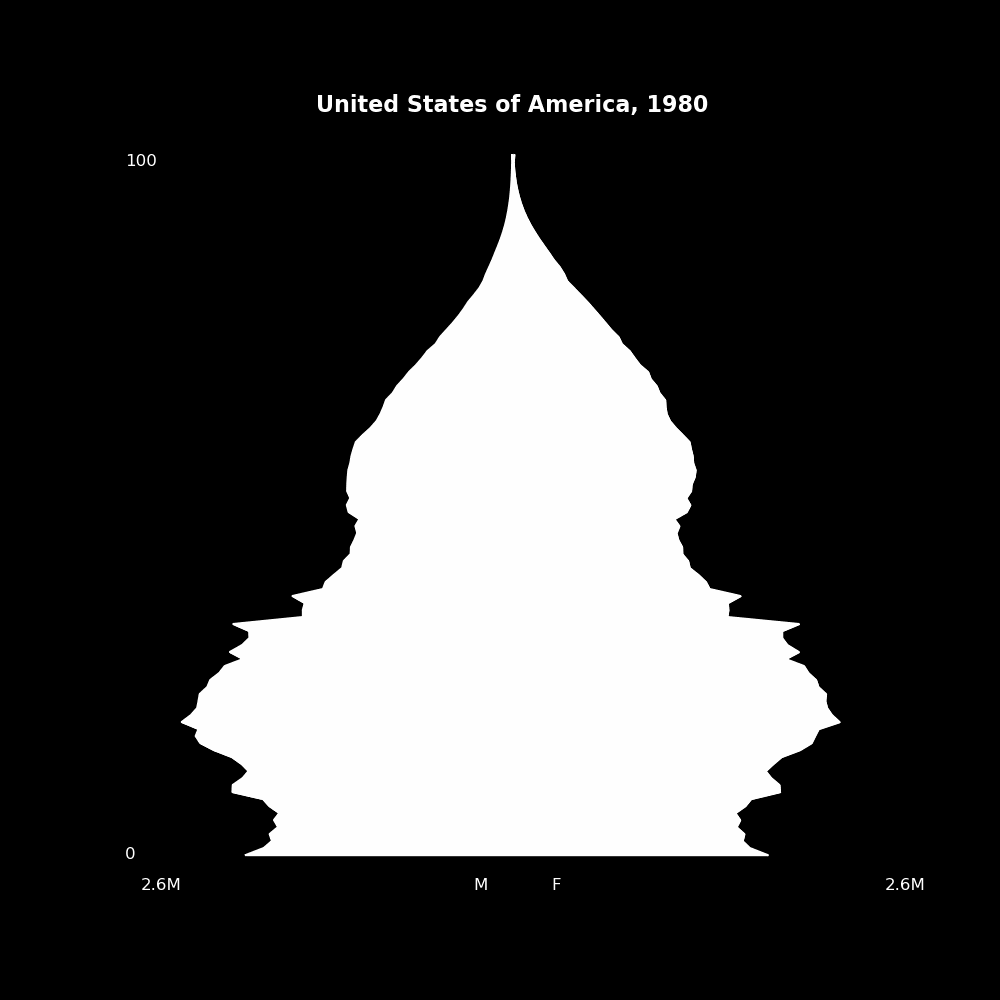
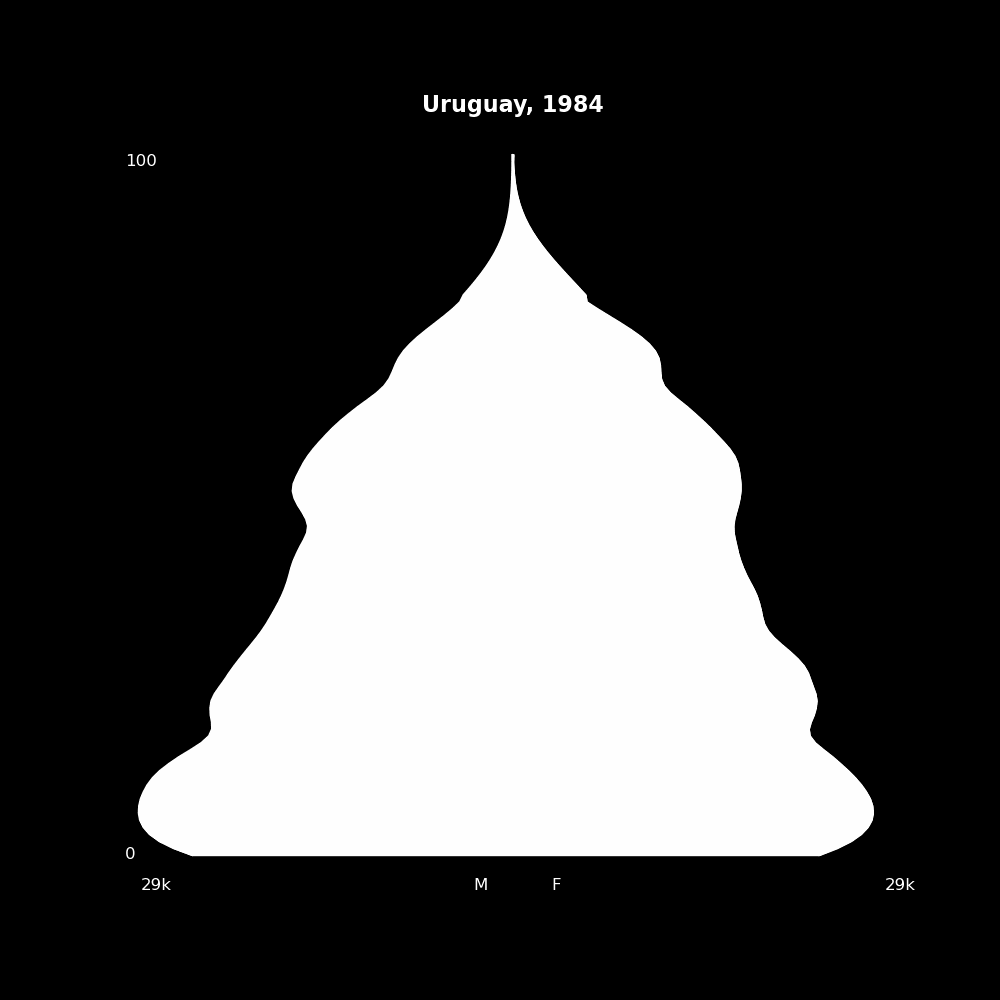
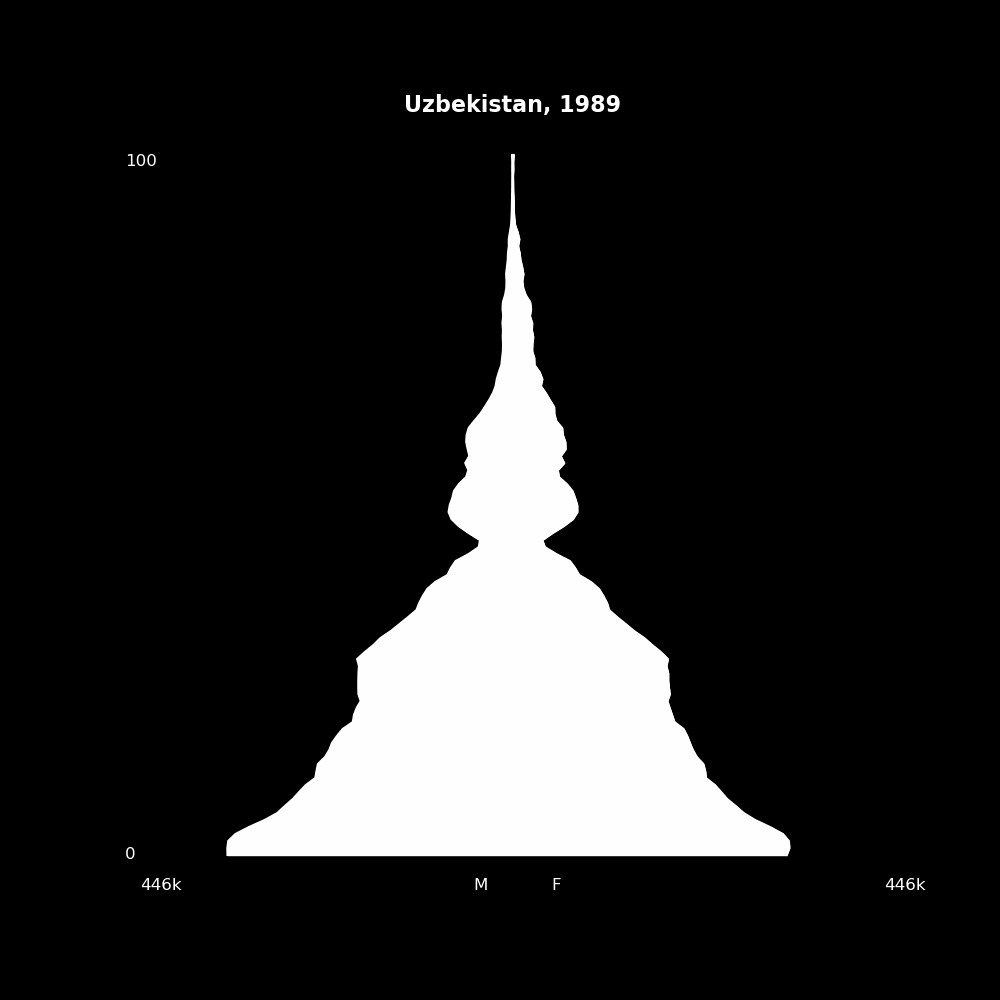
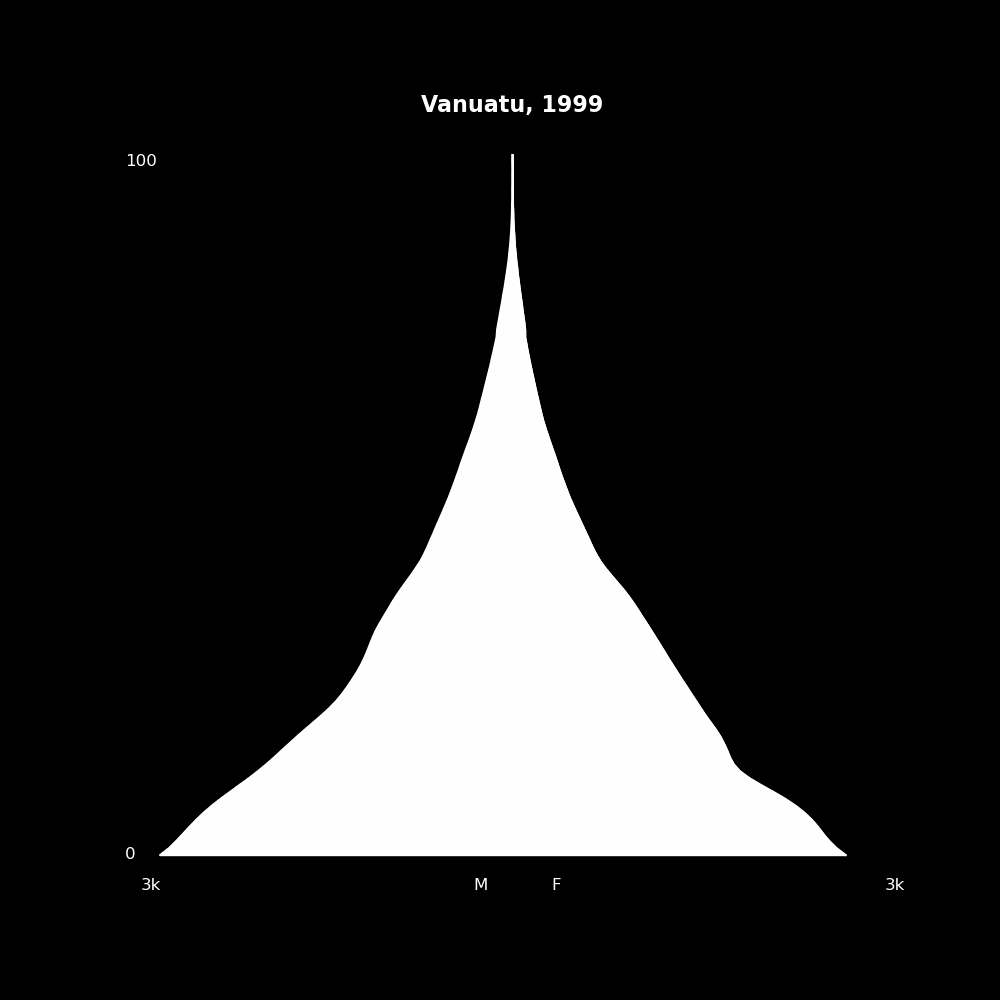
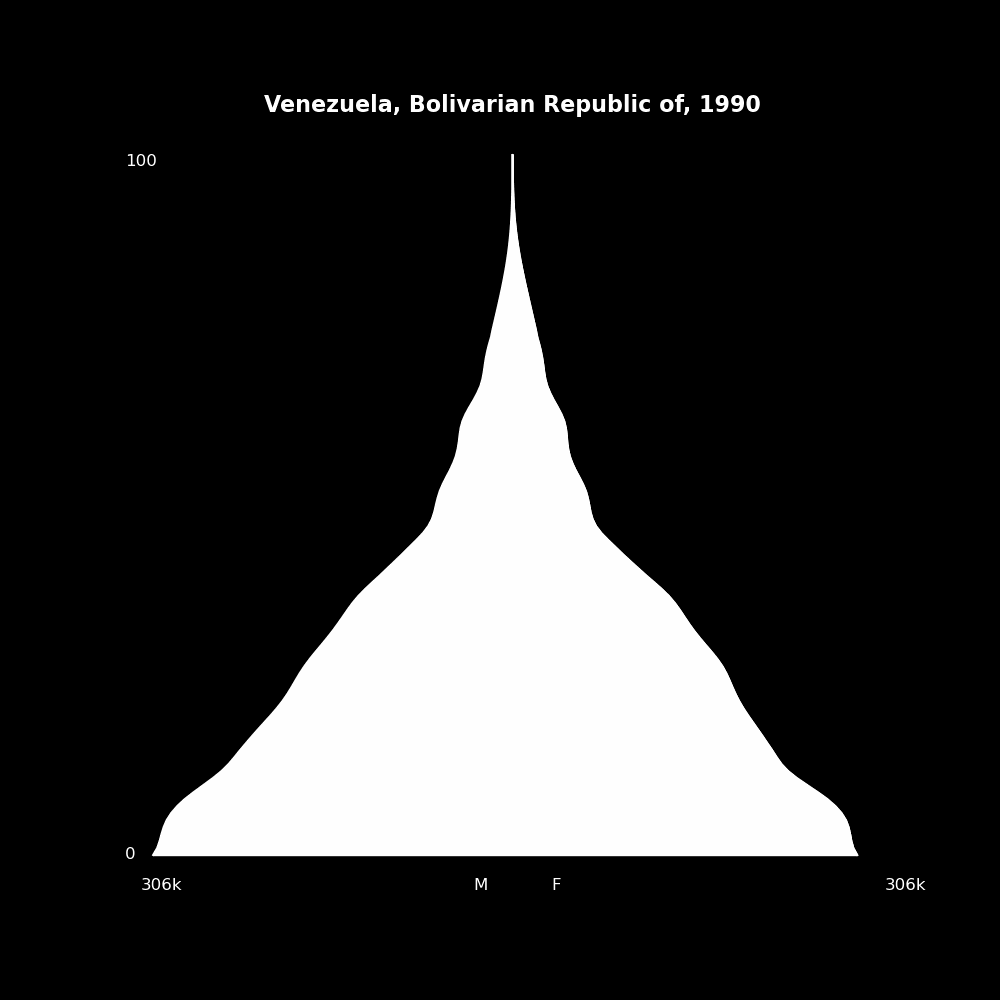
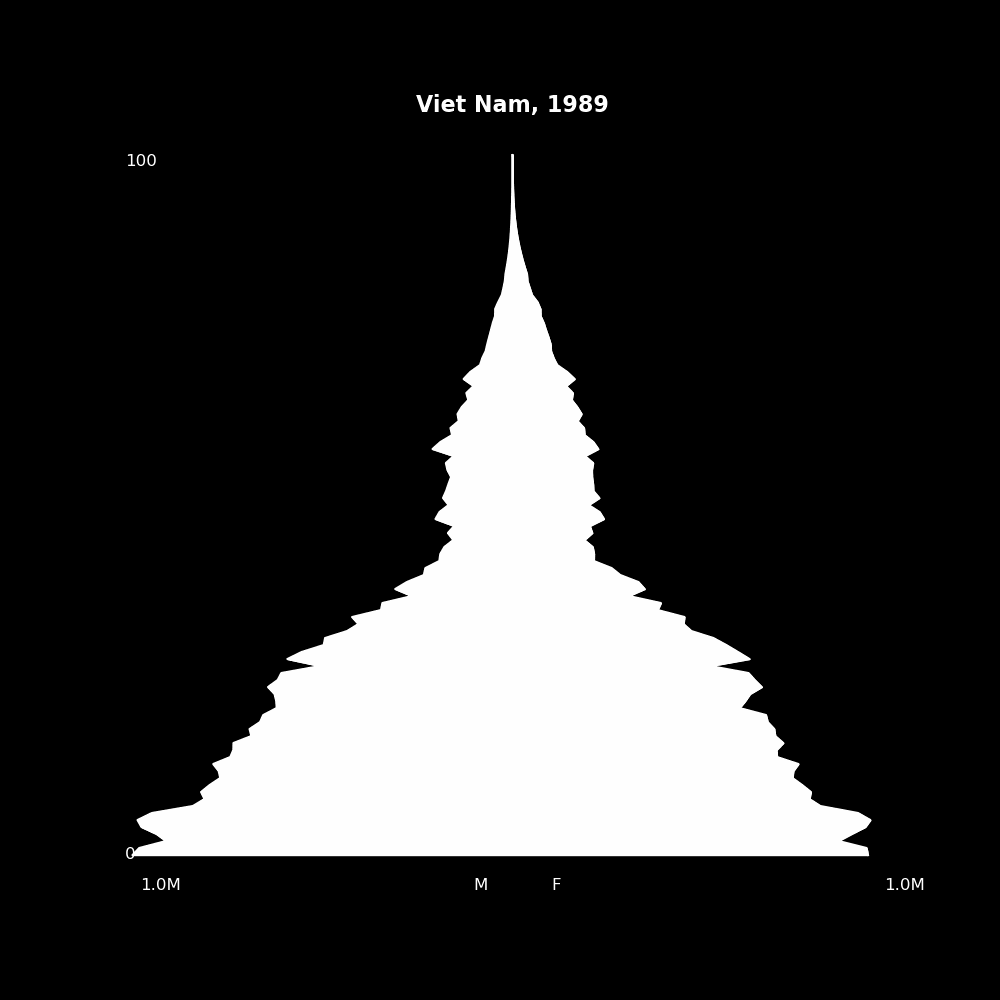
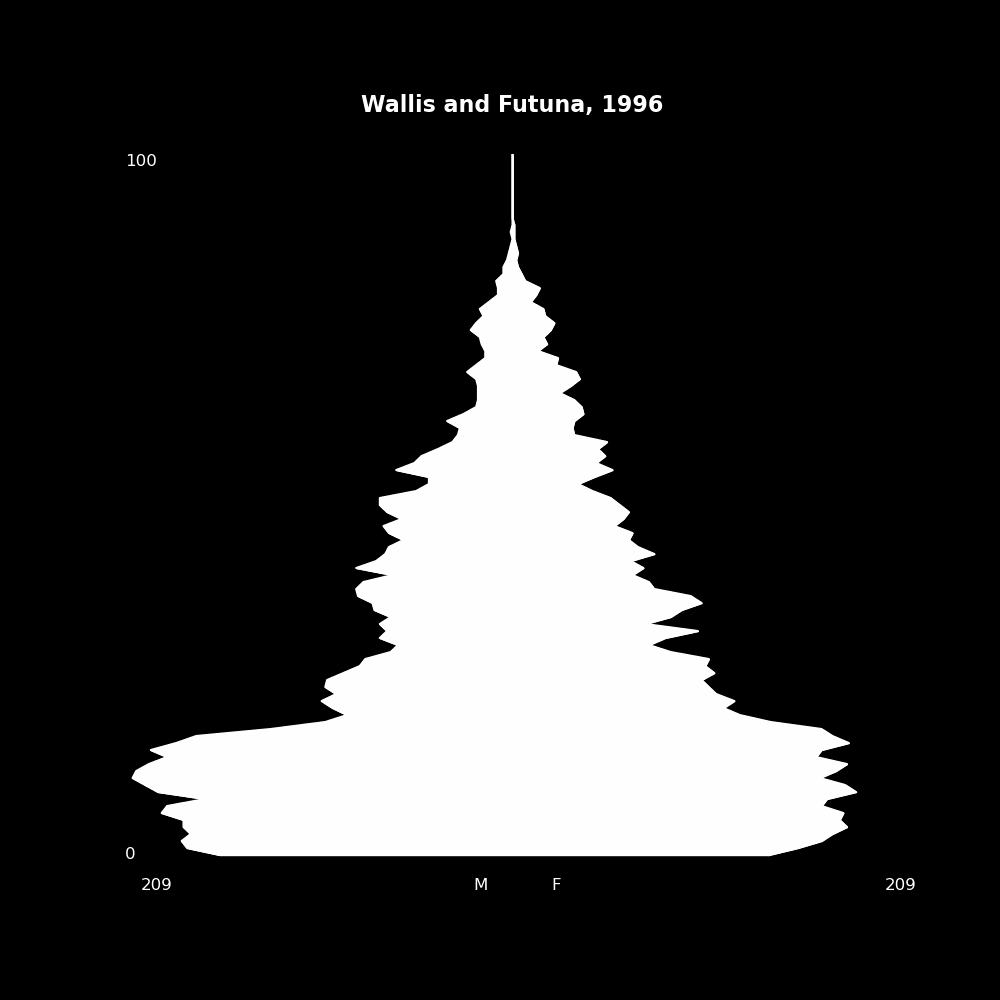
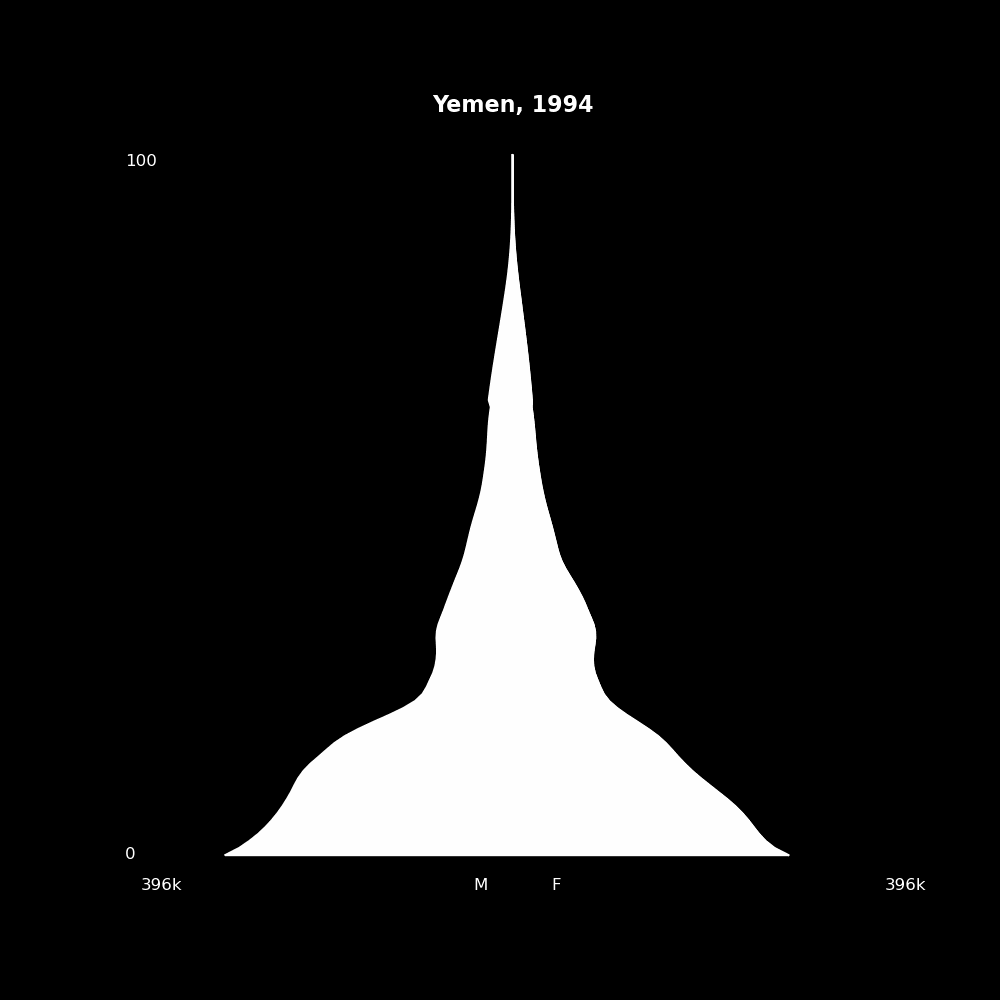
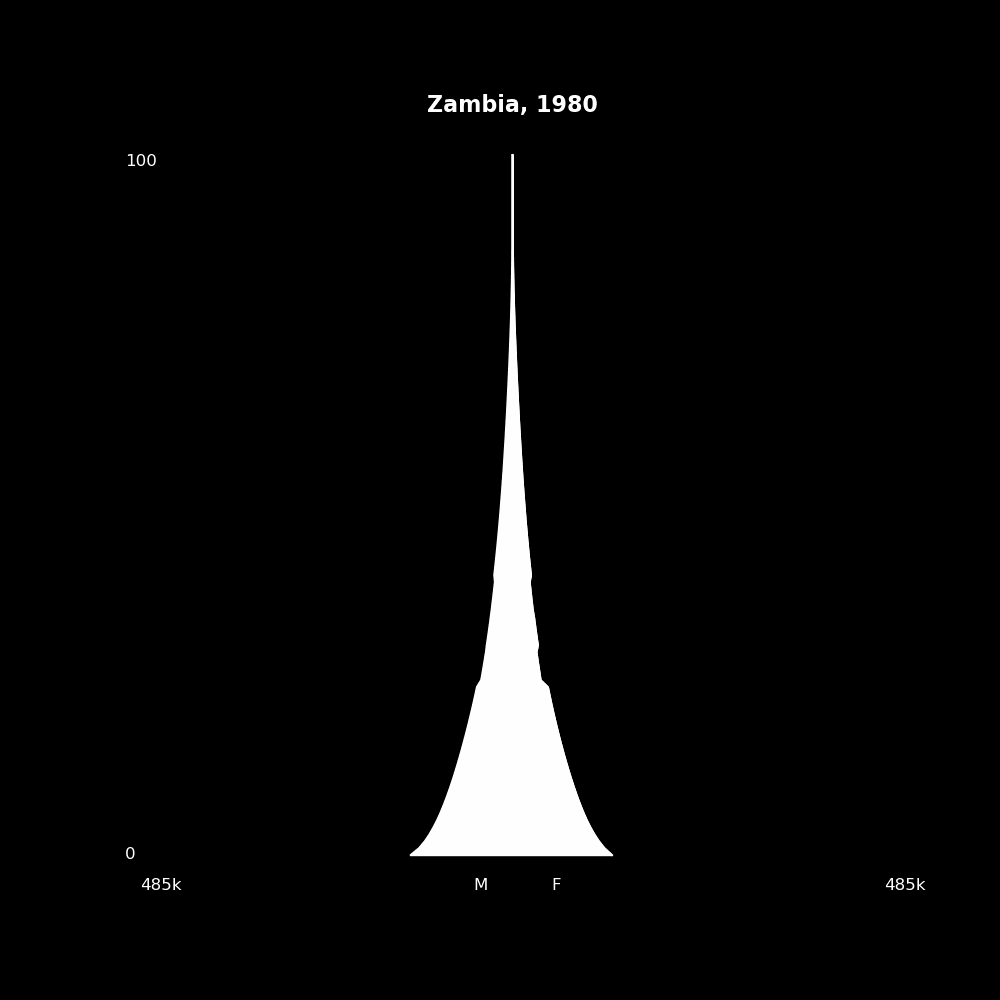
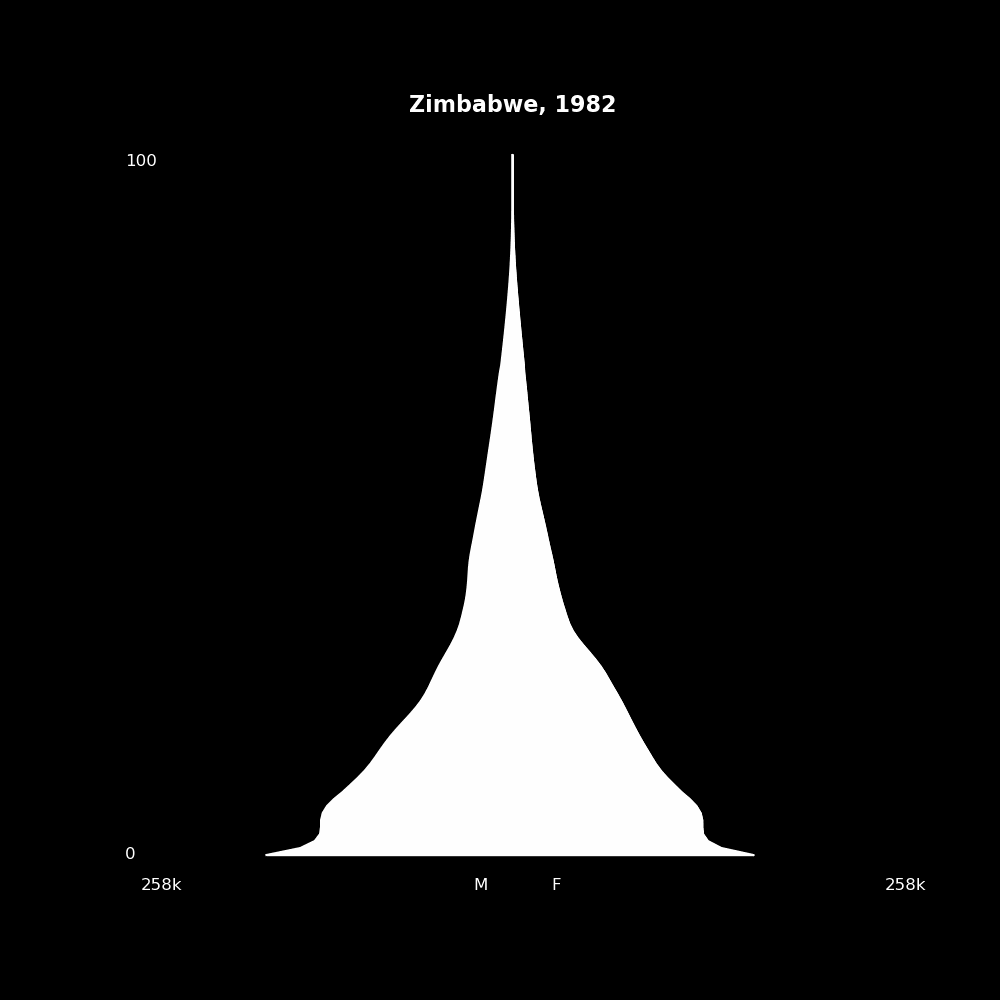
In these population pyramids, the horizontal axis is the population count of males (left half) and females (right half) for each age between 0 to 100 years old (vertical axis). The data is from The U.S. Census Bureau's International Database: World Population Estimates and Projections.